HelpDesk
How to Create PDCA Diagram

This circular arrows diagram sample depicts the Plan–Do–Check–Act cycle.
"PDCA (plan–do–check–act or plan–do–check–adjust) is an iterative four-step management method used in business for the control and continuous improvement of processes and products. It is also known as the Deming circle/ cycle/ wheel, Shewhart cycle, control circle/ cycle, or plan–do–study–act (PDSA). Another version of this PDCA cycle is OPDCA. The added "O" stands for observation or as some versions say "Grasp the current condition." This emphasis on observation and current condition has currency with Lean manufacturing/ Toyota Production System literature." [PDCA. Wikipedia]
The diagram example "PDCA cycle" was created using the ConceptDraw PRO diagramming and vector drawing software extended with the Circular Arrows Diagrams solution from the area "What is a Diagram" of ConceptDraw Solution Park.
Circular arrows diagram

 Plan-Do-Check-Act (PDCA)
Plan-Do-Check-Act (PDCA) solution extends the ConceptDraw PRO software with collection of samples and predesigned vector objects for easy visualization four stages of PDCA cycle, PDSA cycle, or Deming cycle, for illustration effective application of this method to the practical business tasks, for depiction the implementation of changes and solution the problems in business processes. Plan-Do-Check-Act (PDCA) solution helps to design professional-looking and attractive Plan Do Study Act diagrams, PDCA cycle diagrams, PDCA Process diagrams, and to construct the Quality Management Process Models, which all assist to manage efficiently the business processes, to improve quality of work and to reduce significantly the costs.
 Basic Circular Arrows Diagrams
This solution extends ConceptDraw PRO v10 (or later) with samples, templates, and a library of vector stencils for drawing circular arrow diagrams.
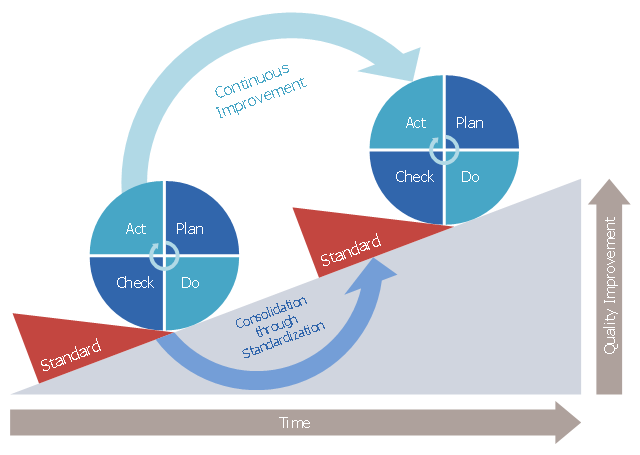
This Deming cycle sample shows plan-do-check-act diagram.
It was designed on the base of Wikimedia Commons file: PDCA Process.png.
"Depiction of the PDCA cycle (or Deming cycle). Continuous quality improvement is achieved by iterating through the cycle and consolidating achieved progress through standardization." [commons.wikimedia.org/ wiki/ File:PDCA_ Process.png]
This file is licensed under the Creative Commons Attribution-Share Alike 3.0 Unported license. [creativecommons.org/ licenses/ by-sa/ 3.0/ deed.en]
The plan-do-check-act diagram example "PDCA Process" was designed using ConceptDraw PRO software extended with Plan-Do-Check-Act (PDCA) solution from Management area of ConceptDraw Solution Park.
Diagram example
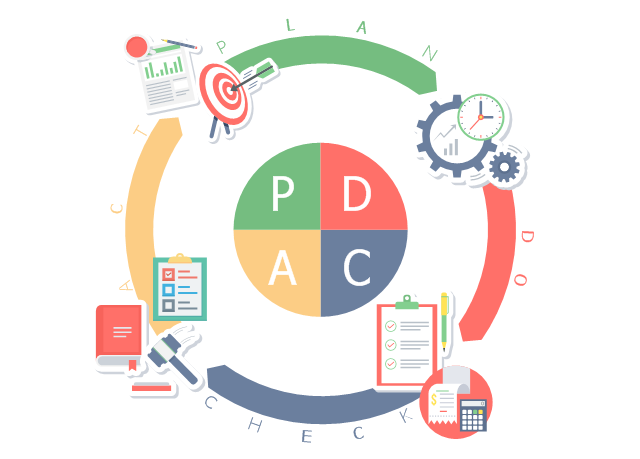
This business infographic sample shows the plan–do–check–act cycle. It was designed on the base of the Wikimedia Commons file: PDCA-Cycle.png.
[commons.wikimedia.org/ wiki/ File:PDCA-Cycle.png]
This file is licensed under the Creative Commons Attribution-Share Alike 3.0 Unported license. [creativecommons.org/ licenses/ by-sa/ 3.0/ deed.en]
"PDCA (plan–do–check–act or plan–do–check–adjust) is an iterative four-step management method used in business for the control and continual improvement of processes and products. It is also known as the Deming circle/ cycle/ wheel, Shewhart cycle, control circle/ cycle, or plan–do–study–act (PDSA)." [PDCA. Wikipedia]
The business infographic example "PDCA cycle" was designed using ConceptDraw PRO diagramming and vector drawing software extended with the Business and Finance solution from Illustration area of ConceptDraw Solution Park.
Infographic
 Fault Tree Analysis Diagrams
This solution extends ConceptDraw PRO v9.5 or later with templates, fault tree analysis example, samples and a library of vector design elements for drawing FTA diagrams (or negative analytical trees), cause and effect diagrams and fault tree diagrams.
- Circular arrows diagram - PDCA cycle | Engineering | With The Aid ...
- Circular arrows diagram - PDCA cycle | Flow chart Example ...
- Circular arrows diagram - PDCA cycle
- Circular arrows diagram - PDCA cycle | Circular Arrow | Circular ...
- PDCA cycle | Circular arrows diagram - PDCA cycle | Total Quality ...
- Circular arrows diagram - PDCA cycle | Europe browser usage ...
- Fishbone Diagram | Entity-Relationship Diagram (ERD) | Plan-Do ...
- PDCA cycle | Attribution Wheel Diagram
- Circular Arrow | Basic Circular Arrows Diagrams | Clipart Pdca Cycle
- Water cycle diagram | Circular arrows diagram - PDCA cycle ...