This circular arrows diagram sample depicts the Plan–Do–Check–Act cycle.
"PDCA (plan–do–check–act or plan–do–check–adjust) is an iterative four-step management method used in business for the control and continuous improvement of processes and products. It is also known as the Deming circle/ cycle/ wheel, Shewhart cycle, control circle/ cycle, or plan–do–study–act (PDSA). Another version of this PDCA cycle is OPDCA. The added "O" stands for observation or as some versions say "Grasp the current condition." This emphasis on observation and current condition has currency with Lean manufacturing/ Toyota Production System literature." [PDCA. Wikipedia]
The diagram example "PDCA cycle" was created using the ConceptDraw PRO diagramming and vector drawing software extended with the Circular Arrows Diagrams solution from the area "What is a Diagram" of ConceptDraw Solution Park.
Circular arrows diagram

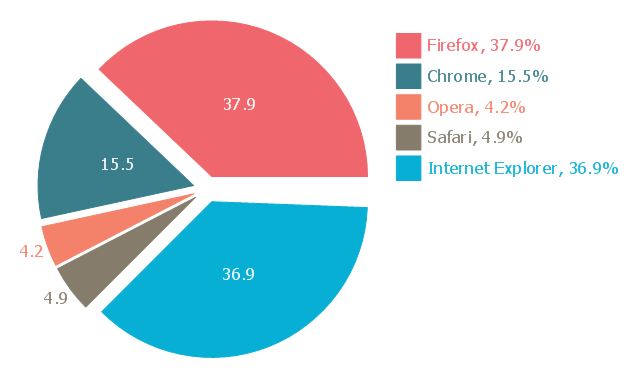
This exploded pie chart sample shows the Europe browser usage share in January 2011. It was designed on the base of the Wikimedia Commons file: 2011 01 Europe Browser share crop.png.
[commons.wikimedia.org/ wiki/ File:2011_ 01_ Europe_ Browser_ share_ crop.png]
This file is licensed under the Creative Commons Attribution 3.0 Unported license. [creativecommons.org/ licenses/ by/ 3.0/ deed.en]
"A chart with one or more sectors separated from the rest of the disk is known as an exploded pie chart. This effect is used to either highlight a sector, or to highlight smaller segments of the chart with small proportions." [Pie chart. Wikipedia]
The exploded pie chart example "Europe browser usage share" was created using the ConceptDraw PRO diagramming and vector drawing software extended with the Pie Charts solution of the Graphs and Charts area in ConceptDraw Solution Park.
Exploded pie chart
- Resistor Symbol Png
- Percentage Chart Png
- Browser Transparent Png
- Rest Png
- Percentage Charts Png
- Crop Vector Png
- Simple switched supply - Circuit diagram | Electrical Symbols ...
- Electrical Symbols — Resistors | Design elements - Resistors ...
- Europe browser usage share | Piechart Related To Agricultural Crops
- Design elements - Resistors | Resistors - Vector stencils library ...
- Pie Chart Examples and Templates | Exploded pie chart ...
- Design elements - Apps icons | App icons - Vector stencils library ...
- Pie Chart Examples and Templates | Donut Chart Templates | BPM ...
- Electrical Symbols — Resistors | Electrical Symbols — Analog and ...
- European membership of the EU and NATO map | World Continents ...
- Mac Graphic User Interface
- How to Manage ConceptDraw Multi - User License | iPhone User ...
- Android GUI | Design elements - Android system icons (av) | Design ...