This example was created on the base of the figure from the website of Minnesota Department of Health. [health.state.mn.us/ divs/ opi/ qi/ images/ fishbone_ ex.png]
"Minnesota’s Health Alert Network (HAN) enables public health staff, tribal governments, health care providers, emergency workers, and others working to protect the public to exchange information during a disease outbreak, environmental threat, natural disaster, or act of terrorism." [health.state.mn.us/ han/ ]
The fishbone diagram example "HAN project" was created using the ConceptDraw PRO diagramming and vector drawing software extended with the Fishbone Diagrams solution from the Management area of ConceptDraw Solution Park.
Ishikawa diagram

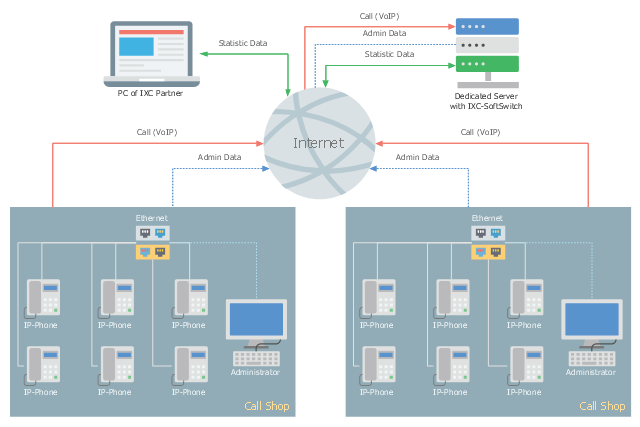
This telecom diagram sample illustrates the call shop solution. It was designed on the base of the Wikimedia Commons file: Call shops.jpg.
[commons.wikimedia.org/ wiki/ File:Call_ shops.jpg]
This file is licensed under the Creative Commons Attribution-Share Alike 3.0 Unported license. [creativecommons.org/ licenses/ by-sa/ 3.0/ deed.en]
"A call shop is a business providing on-site access to telephones for long-distance calling in countries without widespread home long-distance service. Calls may be prepaid or postpaid." [Call shop. Wikipedia]
The telecommunication diagram example "Call shop solution" was created using the ConceptDraw PRO diagramming and vector drawing software extended with the Computers and Communications solution from the Illustration area of ConceptDraw Solution Park.
Telecom diagram
 Fishbone Diagrams
The Fishbone Diagrams solution extends ConceptDraw PRO v10 software with the ability to easily draw the Fishbone Diagrams (Ishikawa Diagrams) to clearly see the cause and effect analysis and also problem solving. The vector graphic diagrams produced using this solution can be used in whitepapers, presentations, datasheets, posters, and published technical material.
- Home area networks ( HAN ). Computer and Network Examples ...
- Home area networks ( HAN ). Computer and Network Examples ...
- Home area networks ( HAN ). Computer and Network Examples ...
- Campus Area Networks (CAN). Computer and Network Examples ...
- Fishbone diagram - HAN project | Relations diagram - Health care ...
- Fishbone diagram - HAN project | Seven Management and Planning ...
- Diagram Of Home Network
- Fishbone Diagram | Fishbone diagram - HAN project | Fishbone ...
- Fishbone Diagram | Fishbone Diagrams | Fishbone diagram - HAN ...
- Home area networks ( HAN ). Computer and Network Examples ...
- Home area networks ( HAN ). Computer and Network Examples ...
- Home Area Network Han Diagram
- Han Diagram
- Home area networks ( HAN ). Computer and Network Examples ...
- Fishbone diagram - HAN project
- Network Diagram Software Home Area Network
- ConceptDraw PRO Network Diagram Tool | Cisco Network Design ...
- Home area networks ( HAN ). Computer and Network Examples ...
- Network Diagram Software Home Area Network | Home area ...
- Fishbone diagram - HAN project | Nitrate concentration in ...