"Consumption of energy resources, (e.g. turning on a light) requires resources and has an effect on the environment. Many electric power plants burn coal, oil or natural gas in order to generate electricity for energy needs. While burning these fossil fuels produces a readily available and instantaneous supply of electricity, it also generates air pollutants including carbon dioxide (CO2), sulfur dioxide and trioxide (SOx) and nitrogen oxides (NOx). Carbon dioxide is an important greenhouse gas which is thought to be responsible for some fraction of the rapid increase in global warming seen especially in the temperature records in the 20th century, as compared with tens of thousands of years worth of temperature records which can be read from ice cores taken in Arctic regions. Burning fossil fuels for electricity generation also releases trace metals such as beryllium, cadmium, chromium, copper, manganese, mercury, nickel, and silver into the environment, which also act as pollutants.
The large-scale use of renewable energy technologies would "greatly mitigate or eliminate a wide range of environmental and human health impacts of energy use". Renewable energy technologies include biofuels, solar heating and cooling, hydroelectric power, solar power, and wind power. Energy conservation and the efficient use of energy would also help." [Energy industry. Environmental impact. Wikipedia]
The Energy resources diagram example was created in the ConceptDraw PRO diagramming and vector drawing software using the Manufacturing and Maintenance solution from the Illustration area of ConceptDraw Solution Park.
Infographics

Energy Pyramid Diagram

LLNL Flow Charts
.jpg "LLNL flow charts")
Diagram of a Pyramid

This bubble diagram sample was designed on the base of the Wikimedia Commons file: Bubble diagram showing the share of global cumulative energy-related carbon dioxide emissions for major emitters between 1890-2007.svg.
"Major emitters are shown (percentage share in brackets): the United States (28%), the European Union (23%), Russia (11%), China (9%), other OECD countries (5%), Japan (4%), India (3%), and the rest of the world (18%). Data are from IEA (2009). ... The area and colouring of the circles is proportional to the share of emissions." [commons.wikimedia.org/ wiki/ File:Bubble_ diagram_ showing_ the_ share_ of_ global_ cumulative_ energy-related_ carbon_ dioxide_ emissions_ for_ major_ emitters_ between_ 1890-2007.svg]
The bubble diagram example "Global cumulative energy-related CO2 emissions" was created using the ConceptDraw PRO diagramming and vector drawing software extended with the Bubble Diagrams solution from the area "What is a Diagram" of ConceptDraw Solution Park.
Bubble diagram

This DFD sample was created on the base of the figure from the NASA website. [asd-www.larc.nasa.gov/ ATBD/ DFD.html]
"Clouds and the Earth's Radiant Energy System (CERES).
EOS-Terra: Understanding Earth's Clouds and Climate.
The Clouds and the Earth's Radiant Energy System (CERES) instrument is one of several that will be flown aboard the Earth Observing System's Terra spacecraft, scheduled for launch in late1999. The data from the CERES instrument will be used to study the energy exchanged between the Sun; the Earth's atmosphere, surface and clouds; and outer space.
The CERES EOS-Terra instrument will be the second CERES instrument in Earth orbit. The first CERES instrument is currently orbiting the Earth aboard the Tropical Rainfall Measuring Mission observatory, which was launched in November 1997. Early results of the TRMM mission show that the first CERES has provided better measurement capabilities than any previous satellite instrument of its kind.
What CERES Will Measure.
CERES will measure the energy at the top of the atmosphere, as well as estimate energy levels in the atmosphere and at the Earth's surface. Using information from very high resolution cloud imaging instruments on the same spacecraft, CERES also will determine cloud properties, including cloud amount, altitude, thickness, and the size of the cloud particles. All of these measurements are critical for advancing our understanding of the Earth's total climate system and further improving climate prediction models.
The CERES instrument is based on NASA Langley's highly successful Earth Radiation Budget Experiment (ERBE) which used three satellites to provide global energy budget measurements from 1984 to 1990." [nasa.gov/ centers/ langley/ news/ factsheets/ CERES.html]
The DFD example "CERES data flow diagram" was created using the ConceptDraw PRO diagramming and vector drawing software extended with the Data Flow Diagrams solution from the Software Development area of ConceptDraw Solution Park.
DFD

 Bubble Diagrams
Bubble diagrams have enjoyed great success in software engineering, architecture, economics, medicine, landscape design, scientific and educational process, for ideas organization during brainstorming, for making business illustrations, presentations, planning, design, and strategy development. They are popular because of their simplicity and their powerful visual communication attributes.
Electrical Symbols — Rotating Equipment

Pyramid Charts

Electrical Symbols — Power Sources

Pyramid Chart Maker

 Target and Circular Diagrams
This solution extends ConceptDraw PRO software with samples, templates and library of design elements for drawing the Target and Circular Diagrams.
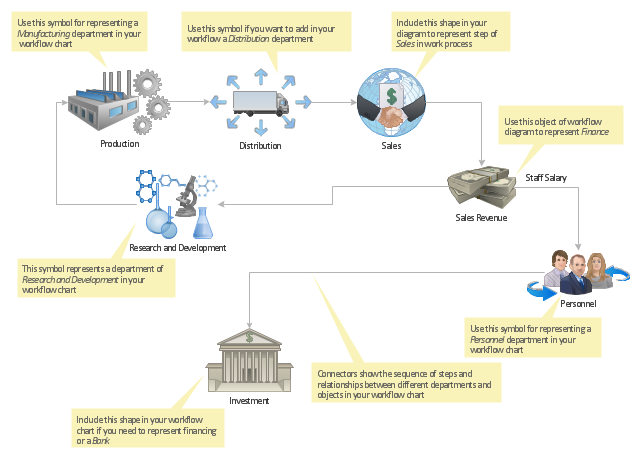
"Workflow components.
A workflow can usually be described using formal or informal flow diagramming techniques, showing directed flows between processing steps. Single processing steps or components of a workflow can basically be defined by three parameters:
(1) input description: the information, material and energy required to complete the step,
(2) transformation rules, algorithms, which may be carried out by associated human roles or machines, or a combination,
(3) output description: the information, material and energy produced by the step and provided as input to downstream steps.
Components can only be plugged together if the output of one previous (set of) component(s) is equal to the mandatory input requirements of the following component. Thus, the essential description of a component actually comprises only in- and output that are described fully in terms of data types and their meaning (semantics). The algorithms' or rules' description need only be included when there are several alternative ways to transform one type of input into one type of output – possibly with different accuracy, speed, etc.
When the components are non-local services that are invoked remotely via a computer network, such as Web services, additional descriptors (such as QoS and availability) also must be considered." [Workflow. Wikipedia]
The workflow diagram template for the ConceptDraw PRO diagramming and vector drawing software is included in the Workflow Diagrams solution from the Business Processes area of ConceptDraw Solution Park.
Workflow diagram template
 Divided Bar Diagrams
The Divided Bar Diagrams Solution extends the capabilities of ConceptDraw PRO v10 with templates, samples, and a library of vector stencils for drawing high impact and professional Divided Bar Diagrams and Graphs, Bar Diagram Math, and Stacked Graph.
Chemical Engineering

- Resources and energy - Vector stencils library | Energy Pyramid ...
- HVAC Plans | Biology | Target and Circular Diagrams | Draw Energy ...
- Resources and energy - Vector stencils library | Energy resources ...
- Chemistry Drawings | Energy resources diagram | Energy ...
- Energy resources diagram | Energy Conservation Diagram
- Circular Arrows Diagrams | Energy resources diagram | Chart ...
- Energy resources diagram | Determine groundwater - IDEF0 ...
- Manufacturing and Maintenance | Energy resources diagram ...
- Energy Pyramid Diagram | Scatter Chart Examples | Chart Examples ...
- Energy Pyramid Diagram | How to Create a Scatter Chart | U.S. ...
- Energy resources diagram | Resources and energy - Vector stencils ...
- Energy resources diagram | CMP adaptive management cycle ...
- Process Flow Diagram | Chemical and Process Engineering ...
- Energy resources diagram | Pie Charts | Manufacturing and ...
- Energy Pyramid Diagram | Fast food restaurant menu prices ...
- Renewable energy | Energy resources diagram | Vector Map of ...
- Active indirect water heater diagram | Energy resources diagram ...
- Energy resources diagram | Types of Flowcharts | Resources and ...
- Process Flow Diagram Symbols | Process Flow Diagram | Energy ...
- Energy Pyramid Diagram | Pyramid Chart Maker | Pyramid Charts ...