UML Component Diagram. Design Elements
")
Rapid UML Solution for ConceptDraw PRO contains 13 vector stencils libraries with 393 interactive shapes that you can use to design your UML diagrams.
To design a Component Diagram use the UML Component Diagram library.
UML Component Diagram library contains 36 shapes

 Event-driven Process Chain Diagrams
Event-driven Process Chain (EPC) Diagram is a type of flowchart widely used for modeling in business engineering and reengineering, business process improvement, and analysis. EPC method was developed within the Architecture of Integrated Information Systems (ARIS) framework.
 Entity-Relationship Diagram (ERD)
Entity-Relationship Diagram (ERD) solution extends ConceptDraw PRO software with templates, samples and libraries of vector stencils from drawing the ER-diagrams by Chen's and crow’s foot notations.
 AWS Architecture Diagrams
The flexible AWS cloud solutions will help you to create reliable applications with a high level of scaling in the AWS cloud, to run your applications and accelerate their work on the level of security. Besides AWS resources are available worldwide and yo
 Fishbone Diagram
Fishbone Diagrams solution extends ConceptDraw PRO software with templates, samples and library of vector stencils for drawing the Ishikawa diagrams for cause and effect analysis.
 IDEF0 Diagrams
IDEF0 Diagrams solution extends ConceptDraw PRO software with templates, samples and library of vector stencils for drawing the IDEF0 diagrams.
UML Deployment Diagram. Design Elements

ConceptDraw has 393 vector stencils in the 13 libraries that helps you to start using software for designing your own UML Diagrams. You can use the appropriate stencils of UML notation from UML Deployment library.
 Entity-Relationship Diagram (ERD)
An Entity-Relationship Diagram (ERD) is a visual presentation of entities and relationships. That type of diagrams is often used in the semi-structured or unstructured data in databases and information systems. At first glance ERD is similar to a flowch
 Spatial Infographics
Spatial infographics solution extends ConceptDraw PRO software with infographic samples, map templates and vector stencils libraries with design elements for drawing spatial information graphics.
ATM Solutions

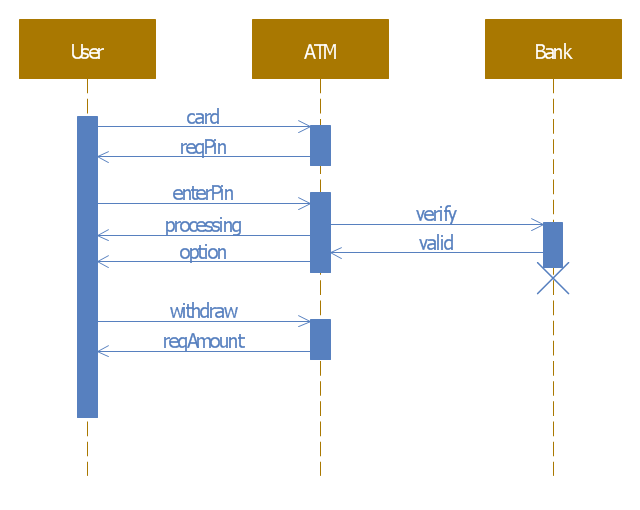
This example of automated teller machine (ATM) UML sequence diagram was created on the base of figure 5 "Sequence diagram" on the webpage "Message Sequence Charts and their Ilk" from the website of the University of California Irvine (UCI) Donald Bren School of Information and Computer Sciences.
"A UML sequence diagram or SD is similar to an MSC but written with a different notation. Presumably the same semantic issues arise, but possibly not since UML semantics are not well-defined. An example is shown in Figure 5.
The timelines are dotted rather than solid, and the name of the component is inside a box at the head of each timeline. The narrow rectangles apparently show when a component is active (unsure precisely what "active" means). An X on a timeline indicates that the component ceases to exist in some sense (unsure precisely how this is meant also). In the example, the Bank timeline has an X simply as an example (presumably the Bank does continue to exist)."
[www.ics.uci.edu/ ~alspaugh/ cls/ shr/ msc.html]
This example of bank ATM sequence diagram was created using the ConceptDraw PRO diagramming and vector drawing software extended with the ATM UML Diagrams solution from the Software Development area of ConceptDraw Solution Park.
Bank ATM UML sequence diagram
 Flowcharts
The Flowcharts Solution for ConceptDraw PRO v10 is a comprehensive set of examples and samples in several different color themes for professionals that need to graphically represent a process. Solution value is added by basic flow chart template and shapes' library of Flowchart notation. ConceptDraw PRO flow chart creator lets one depict a processes of any complexity and length, as well design of the flowchart either vertically or horizontally.
 Aerospace and Transport
This solution extends ConceptDraw PRO software with templates, samples and library of vector clipart for drawing the Aerospace and Transport Illustrations. It contains clipart of aerospace objects and transportation vehicles, office buildings and anci
- Package Diagram With Example In Banking System Model
- UML use case diagram - Banking system
- Uml Deployment Diagram
- UML Deployment Diagram Example - ATM System | UML Diagram ...
- UML Deployment Diagram Example - ATM System | UML Use Case ...
- UML activity diagram - Cash withdrawal from ATM | UML Activity ...
- UML Deployment Diagram Example
- UML Component for Bank | Design elements - Bank UML ...
- UML Deployment Diagram Example - ATM System | UML Use Case ...
- UML Deployment Diagram Example - ATM System | UML Diagram ...
- Design elements - Bank UML component diagram | Design ...
- Deployment Diagram Uml Ppt
- How to Create a Bank ATM Use Case Diagram Using ConceptDraw ...
- UML Deployment Diagram Example - ATM System | Cisco Network ...
- UML Deployment Diagram Example - ATM System | UML Use Case ...
- UML Component Diagram Example - Online Shopping | UML ...
- UML Block Diagram | UML Component Diagram | About UML | Uml ...
- UML Diagram | UML Deployment Diagram Example - ATM System ...
- Use Case Diagrams technology with ConceptDraw PRO | UML ...
- UML Diagram | UML Deployment Diagram Example - ATM System ...