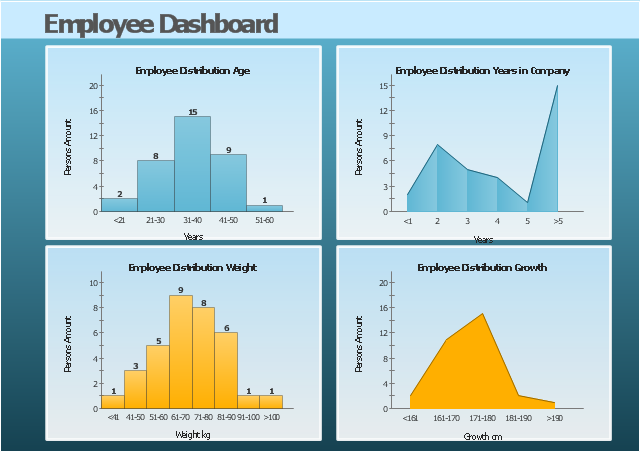
This HR dashboard example include histograms "Employee Distribution by Age" and "Employee Distribution by Weight", and area charts "Employee Distribution by Years in Company" and "Employee Distribution by Growth".
"Human resource management (HRM, or simply HR) is the management process of an organization's workforce, or human resources. It is responsible for the attraction, selection, training, assessment, and rewarding of employees, while also overseeing organizational leadership and culture and ensuring compliance with employment and labor laws. In circumstances where employees desire and are legally authorized to hold a collective bargaining agreement, HR will also serve as the company's primary liaison with the employees' representatives (usually a trades union)." [Human resource management. Wikipedia]
The example "Employee dashboard" was created using the ConceptDraw PRO diagramming and vector drawing software extended with the Frequency Distribution Dashboard solution from the area "What is a Dashboard" of ConceptDraw Solution Park.
Visual dashboard
 Frequency Distribution Dashboard
Frequency distribution dashboard solution extends ConceptDraw PRO software with samples, templates and vector stencils libraries with histograms and area charts for drawing the visual dashboards showing frequency distribution of data.
This example was created on the base of the Georgia DOT Performance Management Dashboard from the Georgia Department of Transportation website.
[dot.ga.gov/ informationcenter/ statistics/ performance/ Pages/ default.aspx]
"Performance management (PM) includes activities which ensure that goals are consistently being met in an effective and efficient manner. Performance management can focus on the performance of an organization, a department, employee, or even the processes to build a product of service, as well as many other areas.
PM is also known as a process by which organizations align their resources, systems and employees to strategic objectives and priorities.
Performance management originated as a broad term coined by Dr. Aubrey Daniels in the late 1970s to describe a technology (i.e. science imbedded in applications methods) for managing both behavior and results, two critical elements of what is known as performance. A formal definition of performance management, according to Daniels' is "a scientifically based, data-oriented management system. It consists of three primary elements-measurement, feedback and positive reinforcement."" [Performance management. Wikipedia]
The meter dashboard example "Georgia DOT Performance Management" was created using the ConceptDraw PRO diagramming and vector drawing software extended with the Meter Dashboard solution from the area "What is a Dashboard" of ConceptDraw Solution Park.
Meter dashboard

"As a discipline, task management embraces several key activities. Various conceptual breakdowns exist, and these, at a high-level, always include creative, functional, project, performance and service activities.
Creative activities pertain to task creation. In context, these should allow for task planning, brainstorming, creation, elaboration, clarification, organization, reduction, targeting and preliminary prioritization.
Functional activities pertain to personnel, sales, quality or other management areas, for the ultimate purpose of ensuring production of final goods and services for delivery to customers. In context these should allow for planning, reporting, tracking, prioritizing, configuring, delegating, and managing of tasks.
Project activities pertain to planning and time and costs reporting. These can encompass multiple functional activities but are always greater and more purposeful than the sum of its parts. In context project activities should allow for project task breakdown, task allocation, inventory across projects, and concurrent access to task databases.
Service activities pertain to client and internal company services provision, including customer relationship management and knowledge management. In context these should allow for file attachment and links to tasks, document management, access rights management, inventory of client & employee records, orders & calls management, and annotating tasks.
Performance activities pertain to tracking performance and fulfillment of assigned tasks. In context these should allow for tracking by time, cost control, stakeholders and priority; charts, exportable reports, status updates, deadline adjustments, and activity logging.
Report activities pertain to the presentation of information regarding the other five activities listed, including graphical display." [Task management. Wikipedia]
The example "Project tasks dashboard" was created using the ConceptDraw PRO diagramming and vector drawing software extended with the Status Dashboard solution from the area "What is a Dashboard" of ConceptDraw Solution Park.
Project tasks dashboard

 25 Typical Orgcharts
The 25 Typical Orgcharts solution contains powerful organizational structure and organizational management drawing tools, a variety of professionally designed organization chart and matrix organization structure samples, 25 templates based on various orga
 Event-driven Process Chain Diagrams
Event-driven Process Chain (EPC) Diagram is a type of flowchart widely used for modeling in business engineering and reengineering, business process improvement, and analysis. EPC method was developed within the Architecture of Integrated Information Systems (ARIS) framework.
HelpDesk
Replace Your Current Diagramming Tool

HelpDesk
How to Create an Individual Resource Calendar

 ConceptDraw Solution Park
ConceptDraw Solution Park collects graphic extensions, examples and learning materials
Strategy Map

 Bubble Diagrams
Bubble diagrams have enjoyed great success in software engineering, architecture, economics, medicine, landscape design, scientific and educational process, for ideas organization during brainstorming, for making business illustrations, presentations, planning, design, and strategy development. They are popular because of their simplicity and their powerful visual communication attributes.
 Basic EPC Diagrams
The Event-driven Process Chain Diagrams solution extends ConceptDraw PRO v10.3.0 software with EPC templates, samples, and vector shape library for the drawing of EPC diagrams.
- Employee distribution - HR dashboard | Frequency Distribution ...
- Employee distribution - HR dashboard | Projects HR dashboard | HR ...
- Employee distribution - HR dashboard | Projects HR dashboard ...
- HR dashboard | Projects HR dashboard | Employee distribution - HR ...
- Employee distribution - HR dashboard | HR dashboard | How to ...
- Employee distribution - HR dashboard | HR dashboard | Frequency ...
- Projects HR dashboard | Employee distribution - HR dashboard | HR ...
- Dashboard | Performance Indicators | Sales Dashboard | Employee ...
- Employee distribution - HR dashboard
- Other Terms For Employee Dashboard
- Status Dashboard | Project Management Dashboards Solution ...
- Other Name For Employee Dashboard
- Frequency Distribution Dashboard | ConceptDraw Solution Park ...
- Enterprise dashboard | KPI Dashboard | Time Series Dashboard ...
- Frequency Distribution Dashboard | Design elements - Frequency ...
- Frequency Distribution Dashboard | Interior Design Storage and ...
- HR dashboard
- HR dashboard - Conceptdraw.com | Sales Process Management ...
- Sales Dashboards for Your Company | A KPI Dashboard | Sales ...
- Projects HR dashboard | Competitor Analysis | Hr Portfolio Examples