This arrow loop diagram sample was created on the base of the figure illustrating the webpage "Safe Roads for a Safer Future A Joint Safety Strategic Plan" from the website of US Department of Transportation - Federal Highway Administration (FHWA) Office of Safety.
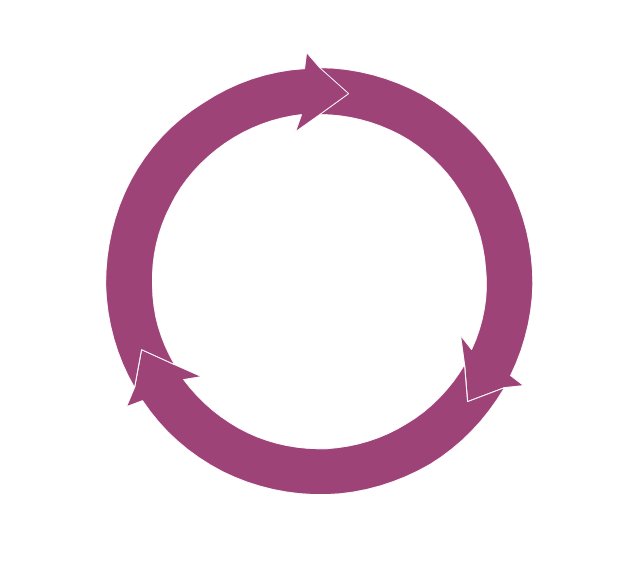
"STRATEGIC PLANNING CYCLE.
After the safety units issue the SSP, they will identify and prioritize strategies to support the established goals. Many strategies will originate in existing roadmaps or in other program planning activities. The safety units will also use this information when developing their Unit Performance Plans and individual performance plans. Teams within each safety unit will carry out projects and activities to support identified strategies and achieve the SSP goals.
The SSP process also includes continuous performance monitoring and evaluation through which the safety units will review past accomplishments against the established goals, consider how well strategies are implemented, assess progress toward goals, identify risks, consider changes in the environment, and discuss future strategic direction. As a part of the evaluation process, the three safety units will recognize achievements and discuss the need for adjustments. Figure ... shows the strategic planning cycle.
The safety units will update the SSP every 3 to 5 years using input from a variety of sources, including evaluations, safety trends, and legislative changes." [safety.fhwa.dot.gov/ ssp/ ]
The arrow loop diagram example "Strategic planning cycle" was created using the ConceptDraw PRO diagramming and vector drawing software extended with the Target and Circular Diagrams solution from the Marketing area of ConceptDraw Solution Park.
www.conceptdraw.com/ solution-park/ marketing-target-and-circular-diagrams
Arrow loop diagram
This arrow loop cycle diagram sample was created on the base of the figure illustrating the webpage "Exploratory Advanced Research Program Hand-Off Workshops" from the US Department of Transportation - Federal Highway Administration (FHWA) website. "The FHWA’s research and technology innovation life cycle illustrates that research and technology development are not insular activities, but integrated processes that together constitute a system.
Following general workshop discussion, a number of common issues emerged among the groups. These centered around the research life cycle, communicating the value of exploratory advanced research, and continued project funding. It was felt that there is a general need to better describe the research and deployment cycle specific to highway transportation and possibly to highway research fields, such as materials or system planning. Research life cycle diagrams show a very linear, chronological process but it is not necessarily that way in reality." [fhwa.dot.gov/ advancedresearch/ pubs/ 11034/ ]
The arrow loop diagram example "Innovation life cycle" was created using the ConceptDraw PRO diagramming and vector drawing software extended with the Target and Circular Diagrams solution from the Marketing area of ConceptDraw Solution Park.
www.conceptdraw.com/ solution-park/ marketing-target-and-circular-diagrams
Arrow loop cycle diagram
Basic Flowchart Symbols and Meaning


This cycle process chart was redesigned from the Wikimedia Commons file: Business Feedback Loop PNG version.png.
"A business ideally is continually seeking feedback from customers: are the products helpful? are their needs being met? Constructive criticism helps marketers adjust offerings to meet customer needs."
[commons.wikimedia.org/ wiki/ File:Business_ Feedback_ Loop_ PNG_ version.png]
The cycle process diagram example "Business feedback loop" was created using the ConceptDraw PRO diagramming and vector drawing software extended with the Sales Flowcharts solution from the Marketing area of ConceptDraw Solution Park.
Customers feedback cycle process chart

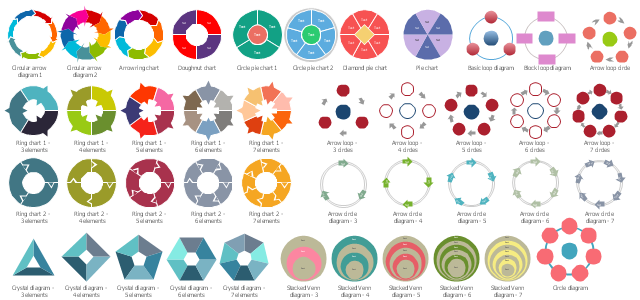
The vector stencils library "Circular diagrams" contains 42 templates of circular diagrams: circular arrow diagram, circular motion diagram, arrow ring chart, doughnut chart (donut chart), circle pie chart, diamond pie chart, circle diagram, pie chart, ring chart, loop diagram, block loop diagram, arrow loop circle, crystal diagram, triangular diagram, diamond diagram, pentagon diagram, hexagon diagram, heptagon diagram, cycle diagram (cycle chart), stacked Venn diagram (onion diagram), arrow circle diagram.
Use these shapes to illustrate your marketing and sales documents, presentations, webpages and infographics in the ConceptDraw PRO diagramming and vector drawing software extended with the Target and Circular Diagrams solution from the Marketing area of ConceptDraw Solution Park.
www.conceptdraw.com/ solution-park/ marketing-target-and-circular-diagrams
Circular arrow diagram 1
Circular arrow diagram 2
Arrow ring chart
Doughnut chart

Diamond pie chart

Pie chart

Circle diagram

Circle pie chart 2

Circle pie chart 1

Ring chart 1 - 3 elements

Ring chart 1 - 4 elements

Ring chart 1 - 5 elements

Ring chart 1 - 6 elements

Ring chart 1 - 7 elements

Ring chart 2 - 3 elements

Ring chart 2 - 4 elements

Ring chart 2 - 5 elements

Ring chart 2 - 6 elements

Ring chart 2 - 7 elements

Crystal diagram - 3 elements

Crystal diagram - 4 elements

Crystal diagram - 5 elements

Crystal diagram - 6 elements

Crystal diagram - 7 elements

Stacked Venn diagram - 4

Stacked Venn diagram - 5

Stacked Venn diagram - 6

Stacked Venn diagram - 7

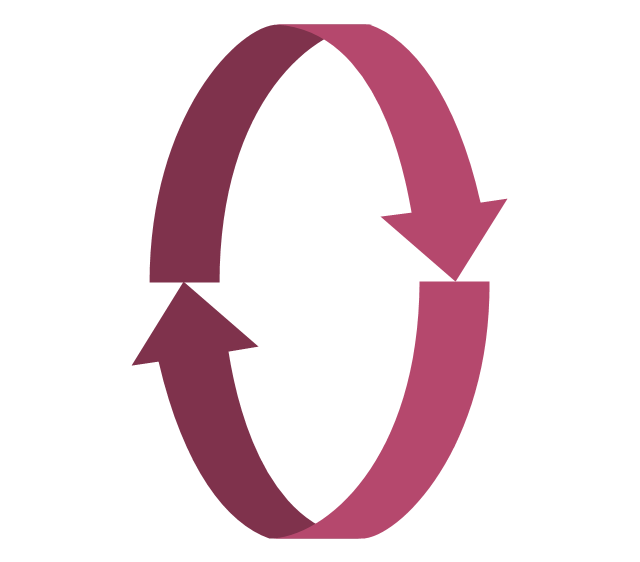
Basic loop diagram

Block loop diagram

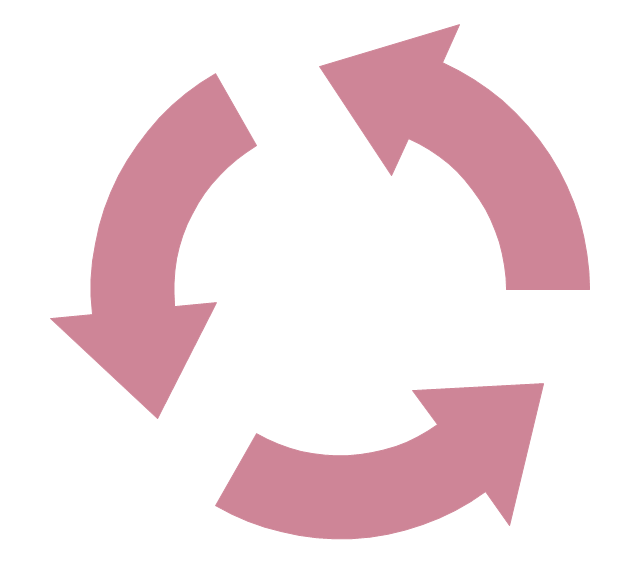
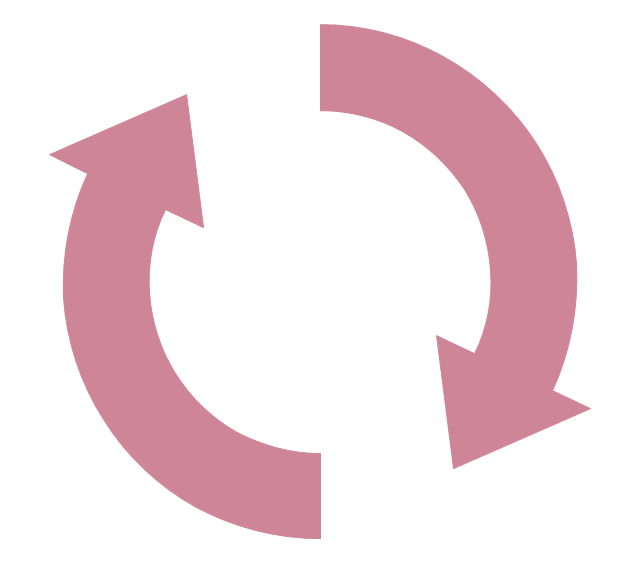
Arrow loop circle
Arrow loop - 3 circles
Arrow loop - 4 circles
Arrow loop - 5 circles
Arrow loop - 6 circles
Arrow loop - 7 circles
Arrow circle diagram - 3
Arrow circle diagram - 4
Stacked Venn diagram - 3

Arrow circle diagram - 5
Arrow circle diagram - 6
Arrow circle diagram - 7
This hexagon diagram sample was redesigned from the Wikipedia file: Virtuous circle in macroeconomics.svg. "An example of the use of a virtuous circle in macroeconomics."
[en.wikipedia.org/ wiki/ File:Virtuous_ circle_ in_ macroeconomics.svg]
"A virtuous circle and a vicious circle (also referred to as virtuous cycle and vicious cycle) are economic terms. They refer to a complex chain of events that reinforces itself through a feedback loop. A virtuous circle has favorable results, while a vicious circle has detrimental results.
Both circles are complexes of events with no tendency towards equilibrium (at least in the short run). Both systems of events have feedback loops in which each iteration of the cycle reinforces the previous one (positive feedback). These cycles will continue in the direction of their momentum until an external factor intervenes and breaks the cycle. The prefix "hyper-" is sometimes used to describe these cycles if they are extreme. The best-known example of a vicious circle is hyperinflation. ...
Example in macroeconomics.
Virtuous circle.
Economic growth can be seen as a virtuous circle. It might start with an exogenous factor such as technological innovation. As people get familiar with the new technology, there could be learning curve effects and economies of scale. This could lead to reduced costs and improved production efficiencies. In a competitive market structure, this will probably result in lower average prices or a decrease in employment as it takes fewer workers to produce the same output. As prices decrease, consumption could increase and aggregate output also. Increased levels of output lead to more learning and scale effects and a new cycle starts."
[en.wikipedia.org/ wiki/ Virtuous_ circle_ and_ vicious_ circle]
The crystal diagram example "Virtuous circle (macroeconomics)" was created using the ConceptDraw PRO diagramming and vector drawing software extended with the Target and Circular Diagrams solution from the Marketing area of ConceptDraw Solution Park.
www.conceptdraw.com/ solution-park/ marketing-target-and-circular-diagrams
Hexagon diagram
---crystal-diagram.png--diagram-flowchart-example.png)
The vector stencils library "Circular diagrams" contains 42 templates of circular diagrams: circular arrow diagram, circular motion diagram, arrow ring chart, doughnut chart (donut chart), circle pie chart, diamond pie chart, circle diagram, pie chart, ring chart, loop diagram, block loop diagram, arrow loop circle, crystal diagram, triangular diagram, diamond diagram, pentagon diagram, hexagon diagram, heptagon diagram, cycle diagram (cycle chart), stacked Venn diagram (onion diagram), arrow circle diagram.
Use these shapes to illustrate your marketing and sales documents, presentations, webpages and infographics in the ConceptDraw PRO diagramming and vector drawing software extended with the Target and Circular Diagrams solution from the Marketing area of ConceptDraw Solution Park.
www.conceptdraw.com/ solution-park/ marketing-target-and-circular-diagrams
Use these shapes to illustrate your marketing and sales documents, presentations, webpages and infographics in the ConceptDraw PRO diagramming and vector drawing software extended with the Target and Circular Diagrams solution from the Marketing area of ConceptDraw Solution Park.
www.conceptdraw.com/ solution-park/ marketing-target-and-circular-diagrams
Circular arrow diagram 1
Circular arrow diagram 2
Arrow ring chart
Doughnut chart
Diamond pie chart
Pie chart
Circle diagram
Circle pie chart 2
Circle pie chart 1
Ring chart 1 - 3 elements
Ring chart 1 - 4 elements
Ring chart 1 - 5 elements
Ring chart 1 - 6 elements
Ring chart 1 - 7 elements
Ring chart 2 - 3 elements
Ring chart 2 - 4 elements
Ring chart 2 - 5 elements
Ring chart 2 - 6 elements
Ring chart 2 - 7 elements
Crystal diagram - 3 elements
Crystal diagram - 4 elements
Crystal diagram - 5 elements
Crystal diagram - 6 elements
Crystal diagram - 7 elements
Stacked Venn diagram - 4
Stacked Venn diagram - 5
Stacked Venn diagram - 6
Stacked Venn diagram - 7
Basic loop diagram
Block loop diagram
Arrow loop circle
Arrow loop - 3 circles
Arrow loop - 4 circles
Arrow loop - 5 circles
Arrow loop - 6 circles
Arrow loop - 7 circles
Arrow circle diagram - 3
Arrow circle diagram - 4
Stacked Venn diagram - 3
Arrow circle diagram - 5
Arrow circle diagram - 6
Arrow circle diagram - 7
This hexagon diagram sample was redesigned from the Wikipedia file: Vicious circle in macroeconomics.svg. "An example of the use of a vicious circle in macroeconomics." [en.wikipedia.org/ wiki/ File:Vicious_ circle_ in_ macroeconomics.svg]
"A virtuous circle and a vicious circle (also referred to as virtuous cycle and vicious cycle) are economic terms. They refer to a complex chain of events that reinforces itself through a feedback loop. A virtuous circle has favorable results, while a vicious circle has detrimental results.
Both circles are complexes of events with no tendency towards equilibrium (at least in the short run). Both systems of events have feedback loops in which each iteration of the cycle reinforces the previous one (positive feedback). These cycles will continue in the direction of their momentum until an external factor intervenes and breaks the cycle. The prefix "hyper-" is sometimes used to describe these cycles if they are extreme. The best-known example of a vicious circle is hyperinflation. ...
Example in macroeconomics.
Vicious circle.
Hyperinflation is a spiral of inflation which causes even higher inflation. The initial exogenous event might be a sudden large increase in international interest rates or a massive increase in government debt due to excessive spendings. Whatever the cause, the government could pay down some of its debt by printing more money (called monetizing the debt). This increase in the money supply could increase the level of inflation. In an inflationary environment, people tend to spend their money quickly because they expect its value to decrease further in the future. They convert their financial assets into physical assets while their money still has some purchasing power. Often they will purchase on credit. Eventually, the currency loses all of its value. Because of this, the level of savings in the country is very low and the government could have problems refinancing its debt. Its solution could be to print still more money starting another iteration of the vicious cycle." [Virtuous circle and vicious circle. Wikipedia]
The crystal diagram example "Vicious circle" was created using the ConceptDraw PRO diagramming and vector drawing software extended with the Target and Circular Diagrams solution from the Marketing area of ConceptDraw Solution Park.
www.conceptdraw.com/ solution-park/ marketing-target-and-circular-diagrams
Hexagon diagram

The vector stencils library "Circular diagrams" contains 42 templates of circular diagrams: circular arrow diagram, circular motion diagram, arrow ring chart, doughnut chart (donut chart), circle pie chart, diamond pie chart, circle diagram, pie chart, ring chart, loop diagram, block loop diagram, arrow loop circle, crystal diagram, triangular diagram, diamond diagram, pentagon diagram, hexagon diagram, heptagon diagram, cycle diagram (cycle chart), stacked Venn diagram (onion diagram), arrow circle diagram.
The example of marketing diagrams templates "Design elements - Circular diagrams" for the ConceptDraw PRO diagramming and vector drawing software is included the Target and Circular Diagrams solution from the Marketing area of ConceptDraw Solution Park.
www.conceptdraw.com/ solution-park/ marketing-target-and-circular-diagrams
Circular diagrams templates
 Target and Circular Diagrams
This solution extends ConceptDraw PRO software with samples, templates and library of design elements for drawing the Target and Circular Diagrams.
The vector stencils library "HR arrows" contains 57 arrow pictograms.
Use this arrow icon set to draw your HR flowcharts, workflow diagrams and process charts with the ConceptDraw PRO diagramming and vector drawing software.
The arrow icons library "HR arrows" is included in the HR Flowcharts solution from the Management area of ConceptDraw Solution Park.
Use this arrow icon set to draw your HR flowcharts, workflow diagrams and process charts with the ConceptDraw PRO diagramming and vector drawing software.
The arrow icons library "HR arrows" is included in the HR Flowcharts solution from the Management area of ConceptDraw Solution Park.
Arki arrow
Chevron arrow
Triangle arrow
Small arrow
Up arrow
Down arrow
Right arrow
Left arrow
Vertical moving arrow
Wavy arrow
Fat arrow
Straight arrow
Angle arrow
Double headed arrow
Single headed arrow
Elbow arrow
Crossed arrows

Turn left arrow
Turn right arrow
L-shaped arrow
Corner arrow
Diagonal arrow
Split arrow
Arc arrow
Bent arrow
Go back arrow
Double headed semicircle arrow
Counterclockwise arrow
Sector arrow
Clockwise arrow
Arrow fork
Merging arrows

U-shaped arrow
Semicircle arrow
Circular arrow
Looping arrows
Refresh arrows
Double arc arrow
Curving directional arrow
S-shaped arrow
Short arc arrow
Long arc arrow
Turn round arrow
Rotating arrows
Turned arrow
Curved left arrow
Curved right arrow
Cycle arrow
Arrow loop
Moving down arrow
Moving up arrow
Dual short arc arrow
Recycling arrows

Interaction arrows

Lightning arrow
Ribbon arrow
Circular motion arrows
What Is a Circle Spoke Diagram

The vector stencils library "Cross-functional flowcharts" contains 31 flow chart symbols. Use it for drawing cross-functional and deployment flowcharts the ConceptDraw PRO diagramming and vector drawing software extended with the Cross-Functional Flowcharts solution from the Business Processes area of ConceptDraw Solution Park.
Swimlanes Vertical
Swimlanes Horizontal

Terminator

Process

Decision

Yes
No
YES/NO
Data

Manual Operation

Document

Predefined Process

Stored Data

Internal Storage

Sequential Data
Direct Data
Manual Input

Card

Paper Tape

Display
Preparation

Parallel Mode

Loop limit

On-page Reference

Off-Page Reference (Outgoing)
-cross-functional-flowcharts---vector-stencils-library.png--diagram-flowchart-example.png)
Off-Page Reference (Incoming)
-cross-functional-flowcharts---vector-stencils-library.png--diagram-flowchart-example.png)
Off-page Reference (Circle)
-cross-functional-flowcharts---vector-stencils-library.png--diagram-flowchart-example.png)
Off-Page Reference (Arrow)
-cross-functional-flowcharts---vector-stencils-library.png--diagram-flowchart-example.png)
Annotation
Control Transfer
Condition
The vector stencils library "Sales flowchart" contains 62 sales process flow chart symbols.
Use these flow chart icon set to draw your sales flowcharts, workflow diagrams and process charts with the ConceptDraw PRO diagramming and vector drawing software.
The sales process flowchart symbols library "Sales flowchart" is included in the Sales Flowcharts solution from the Marketing area of ConceptDraw Solution Park.
Annotation

Card

Check / audit (diamond)
-sales-flowchart---vector-stencils-library.png--diagram-flowchart-example.png)
Check / audit (square)
-sales-flowchart---vector-stencils-library.png--diagram-flowchart-example.png)
Collate

Comment / note symbol (brace)
-sales-flowchart---vector-stencils-library.png--diagram-flowchart-example.png)
Communication link

Compare (diamond)
-sales-flowchart---vector-stencils-library.png--diagram-flowchart-example.png)
Compare (square)
-sales-flowchart---vector-stencils-library.png--diagram-flowchart-example.png)
Completed form

Concurrency symbol (fork / join)
-sales-flowchart---vector-stencils-library.png--diagram-flowchart-example.png)
Conditional selector

Control transfer

Database

Data input / output

Decision

Decision indicator - No

Decision indicator - Yes

Delay

Direct access storage

Disk storage

Display

Divided process (table view)
-sales-flowchart---vector-stencils-library.png--diagram-flowchart-example.png)
Document

Entity (rounded)
-sales-flowchart---vector-stencils-library.png--diagram-flowchart-example.png)
Event

Extract

Flow line

Internal storage

Junction symbol

Lined document

Lined / shaded process

Loop limit

Manual file

Manual input

Manual operation

Merge

Multi document

Multi process

Off-page reference - arrow
Off-page reference - incoming

Off-page reference - outgoing

On-page reference/ Inspection point

Or

Page

Paper tape

Predefined process

Prepare conditional

Process step

Reference point

Sequential access storage

Sort

Start (circle)
-sales-flowchart---vector-stencils-library.png--diagram-flowchart-example.png)
Start (ellipse)
-sales-flowchart---vector-stencils-library.png--diagram-flowchart-example.png)
Stickman pictogram

Stored data

Summary

Tagged document

Tagged process

Terminal point

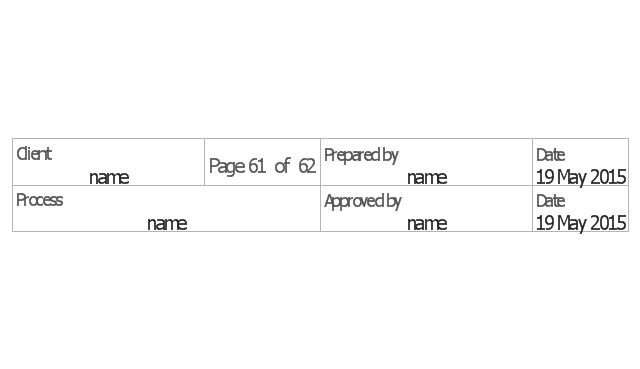
Title block
Torso pictogram

- Innovation life cycle - Arrow loop diagram | Strategic planning cycle ...
- Target Logo With Arrow
- Strategic planning cycle - Arrow loop diagram | Process Flow Maps ...
- Circle Logo Png Vector
- Basic Flowchart Symbols and Meaning | Vicious circle - Crystal ...
- App icons - Vector stencils library | Business feedback loop | Time ...
- Circle Logo Chart
- Virtuous circle (macroeconomics) - Crystal diagram | Vicious circle ...
- Motion Logo
- Innovation life cycle - Arrow loop diagram | BPR Diagram. Business ...
- Purple Circle Logo
- Pentagon Logo
- Strategic planning cycle - Arrow loop diagram | Business feedback ...
- Circle Logo Arrow
- Systems development life cycle | Innovation life cycle - Arrow loop ...
- Water cycle diagram | Strategic planning - Cycle diagram ...
- Innovation life cycle - Arrow loop diagram | National Preparedness ...
- Strategic planning - Cycle diagram
- Software workflow diagram | Innovation life cycle - Arrow loop ...
- Innovation life cycle - Arrow loop diagram