 Fishbone Diagram
Fishbone Diagrams solution extends ConceptDraw DIAGRAM software with templates, samples and library of vector stencils for drawing the Ishikawa diagrams for cause and effect analysis.
 Entity-Relationship Diagram (ERD)
Entity-Relationship Diagram (ERD) solution extends ConceptDraw DIAGRAM software with templates, samples and libraries of vector stencils from drawing the ER-diagrams by Chen's and crow’s foot notations.
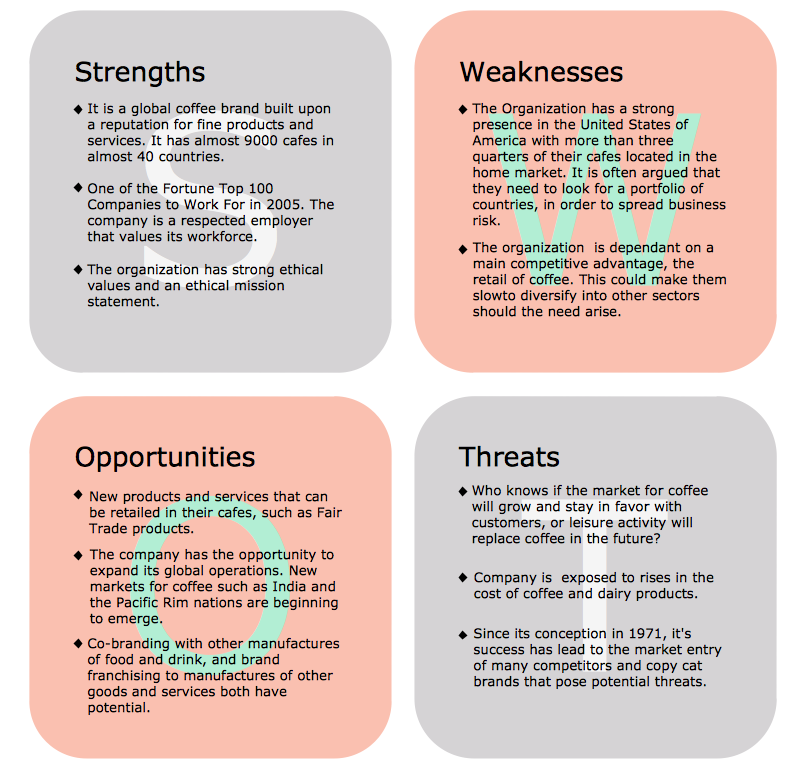
What is SWOT Analysis in Marketing
What is SWOT analysis in marketing? SWOT analysis gives for analysts, marketing specialists and other professionals the perfect ability to identify the positives and negatives in an organization, as well as in the external environment. The SWOT and TOWS methods were developed for business and industry, they involve the specifying of a project's objective and identifying internal and external causes for accomplishing the project goals. A full awareness about the situation within and around your business can help effectively with both strategic planning and decision-making. ConceptDraw DIAGRAM and ConceptDraw MINDMAP software allow professionals to make the situation analysis, to develop strategies and plans for achievement defined objectives, to suppose the possible scenarios of further activity, to see the whole situation at a glance, to create well-designed SWOT and TOWS matrices in minutes. The SWOT and TOWS Matrix Diagrams solution from ConceptDraw Solution Park includes the SWOT matrix samples and templates that allow users quickly create their own SWOT and TOWS diagrams.Business Tools Perceptual Mapping
This sample shows the Perceptual map. It was created in ConceptDraw DIAGRAM diagramming and vector drawing software using the Matrices Solution from the Marketing area of ConceptDraw Solution Park. Perception Mapping helps organizations measure and transform all aspects of their business, people and culture. Perception Mapping allows to represent the complex relationships graphically, helps identify potential problems of the organization and make the best decisions.- Quality Mind Maps - samples and templates | Entity Relationship ...
- SWOT Analysis Solution - Strategy Tools | Positioning map ...
- How to Draw an Organization Chart | Organizational Structure ...
- Basic Flowchart Symbols | Business diagrams ... - Conceptdraw .com
- Technical Drawing Software | Developing Entity Relationship ...
- Company's organizational chart - Conceptdraw .com
- Flow Chart Symbols | Basic Flowchart Symbols | Flowchart Software |
- What is SWOT Analysis in Marketing | Positioning map (Perceptual ...
- Ansoff's Product / Market matrix - Conceptdraw .com
- Ansoff product/market growth matrix - Positioning matrix | Matrices ...
- Business diagrams & Org Charts with ConceptDraw PRO | Basic ...
- Business diagrams & Org Charts with ConceptDraw PRO | Process ...
- Ansoff product/market growth matrix - Positioning matrix | Positioning ...
- Ansoff product/market growth matrix - Positioning matrix | Swot ...
- SWOT Analysis Solution - Strategy Tools | Swot Analysis Examples ...
- ER Diagrams with ConceptDraw PRO | Entity-Relationship Diagram ...
- Timeline Diagrams | Business diagrams & Org Charts with ...
- Work Flow Diagrams with ConceptDraw PRO | Business Process ...
- Software Diagrams | Software and Database Design with ...
- Business diagrams & Org Charts with ConceptDraw PRO | Business ...

