"In mathematics, the Euclidean algorithm, or Euclid's algorithm, is a method for computing the greatest common divisor (GCD) of two (usually positive) integers, also known as the greatest common factor (GCF) or highest common factor (HCF). ...
The GCD of two positive integers is the largest integer that divides both of them without leaving a remainder (the GCD of two integers in general is defined in a more subtle way).
In its simplest form, Euclid's algorithm starts with a pair of positive integers, and forms a new pair that consists of the smaller number and the difference between the larger and smaller numbers. The process repeats until the numbers in the pair are equal. That number then is the greatest common divisor of the original pair of integers.
The main principle is that the GCD does not change if the smaller number is subtracted from the larger number. ... Since the larger of the two numbers is reduced, repeating this process gives successively smaller numbers, so this repetition will necessarily stop sooner or later - when the numbers are equal (if the process is attempted once more, one of the numbers will become 0)." [Euclidean algorithm. Wikipedia]
The flowchart example "Euclidean algorithm" was created using the ConceptDraw PRO diagramming and vector drawing software extended with the Mathematics solution from the Science and Education area of ConceptDraw Solution Park.
 Mathematics
Mathematics solution extends ConceptDraw PRO software with templates, samples and libraries of vector stencils for drawing the mathematical illustrations, diagrams and charts.
HelpDesk
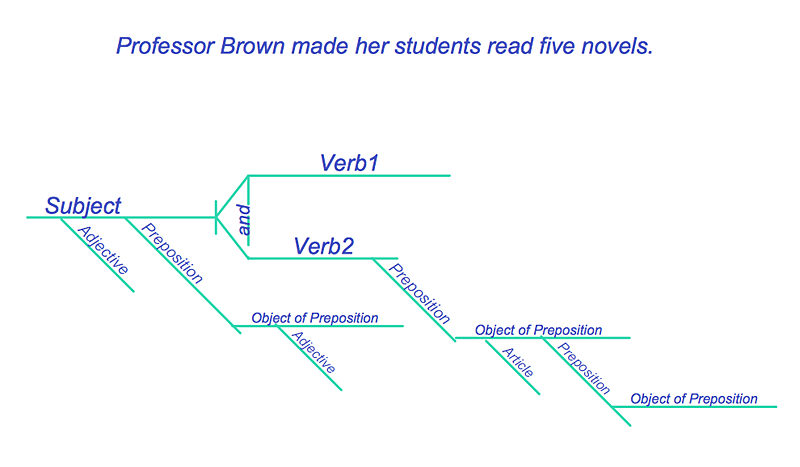
How to Diagram Sentences in ConceptDraw PRO
Diagramming sentences is a playful, fun way to learning English Grammer. Sentences can be very complex, and can contain many different parts of speech which implicate many different grammatical rules. Diagramming sentences will help you to make sure every parts of your sentence are grammatically correct, and provides you with more comprehensive understanding of the English Language. A Sentence Diagram displays the parts of a sentence as a diagram in order to show the relationship of words and groups of words within the sentence. Sentence Diagram shows the relationship between the proposal of its parts. This is a good way to teach grammar! Sentence Diagram helps to make the writing more coherent as well as more interesting to read. ConceptDraw PRO allows you to create clear sentence diagrams using the special templates and vector stencils library.
 Entity-Relationship Diagram (ERD)
An Entity-Relationship Diagram (ERD) is a visual presentation of entities and relationships. That type of diagrams is often used in the semi-structured or unstructured data in databases and information systems. At first glance ERD is similar to a flowch
 Data Flow Diagrams (DFD)
Data Flow Diagrams solution extends ConceptDraw PRO software with templates, samples and libraries of vector stencils for drawing the data flow diagrams (DFD).
- Computer Science Step By Step Procedures To Writing A Program ...
- Flow Charts And Model Computer Science
- Circle Flow Chart Computer Science
- Example Of Simple Flow Chart In Science
- Euclidean algorithm - Flowchart | Basic Flowchart Symbols and ...
- Flow Chatting Examples In Computer Science
- Venn Diagram Examples for Problem Solving. Computer Science ...
- Solving quadratic equation algorithm - Flowchart | Mathematics ...
- Flowchart Programming Project . Flowchart Examples | Top 5 ...
- How To Write The Stages Of Software Development Life Cycles For ...
- Software Diagrams | Basic Diagramming | Flowcharting Software ...
- Solving quadratic equation algorithm - Flowchart | Basic ...
- Basic Flowchart Symbols and Meaning | Process Flowchart | Cross ...
- IDEF0 standard with ConceptDraw PRO | Sales Process Flowchart ...
- How to Draw an Organization Chart | Top 5 Android Flow Chart ...
- Basic Flowchart Symbols and Meaning | Process Flowchart ...
- Euclidean algorithm - Flowchart | Solving quadratic equation ...
- How to Diagram Sentences in ConceptDraw PRO | Basic Flowchart ...
- Computer Flowchart Structure
- Types of Flowcharts | Basic Flowchart Symbols and Meaning ...

