Flowchart on Bank. Flowchart Examples


Sales Steps

"In elementary algebra, a quadratic equation (from the Latin quadratus for "square") is any equation having the form
ax^2+bx+c=0
where x represents an unknown, and a, b, and c are constants with a not equal to 0. If a = 0, then the equation is linear, not quadratic. The constants a, b, and c are called, respectively, the quadratic coefficient, the linear coefficient and the constant or free term.
Because the quadratic equation involves only one unknown, it is called "univariate". The quadratic equation only contains powers of x that are non-negative integers, and therefore it is a polynomial equation, and in particular it is a second degree polynomial equation since the greatest power is two.
Quadratic equations can be solved by a process known in American English as factoring and in other varieties of English as factorising, by completing the square, by using the quadratic formula, or by graphing." [Quadratic equation. Wikipedia]
The flowchart example "Solving quadratic equation algorithm" was created using the ConceptDraw PRO diagramming and vector drawing software extended with the Mathematics solution from the Science and Education area of ConceptDraw Solution Park.
Solving quadratic equation flow chart

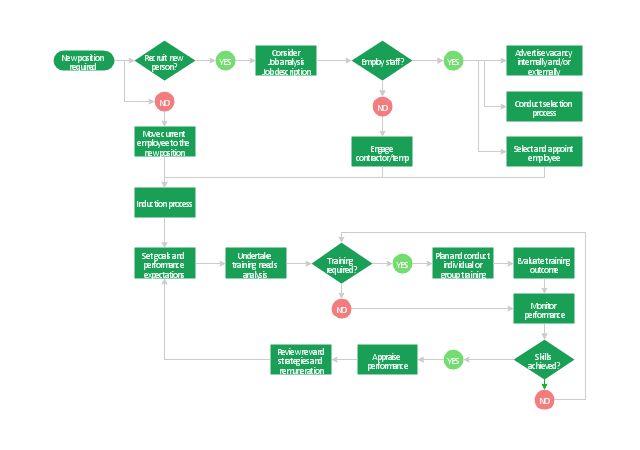
"Human resource management (HRM, or simply HR) is the management process of an organization's workforce, or human resources. It is responsible for the attraction, selection, training, assessment, and rewarding of employees, while also overseeing organizational leadership and culture and ensuring compliance with employment and labor laws. In circumstances where employees desire and are legally authorized to hold a collective bargaining agreement, HR will also serve as the company's primary liaison with the employees' representatives (usually a trades union).
HR is a product of the human relations movement of the early 20th century, when researchers began documenting ways of creating business value through the strategic management of the workforce. The function was initially dominated by transactional work, such as payroll and benefits administration, but due to globalization, company consolidation, technological advancement, and further research, HR now focuses on strategic initiatives like mergers and acquisitions, talent management, succession planning, industrial and labor relations, and diversity and inclusion." [Human resource management. Wikipedia]
The flow chart example "HR management process" was created using the ConceptDraw PRO diagramming and vector drawing software extended with the Flowcharts solution from the area "What is a Diagram" of ConceptDraw Solution Park.
Flowchart - HR management process
 Logistics Flow Charts
Logistics Flow Charts solution extends ConceptDraw DIAGRAM functionality with opportunities of powerful logistics management software. It provides large collection of predesigned vector logistic symbols, pictograms, objects and clipart to help you design with pleasure Logistics flow chart, Logistics process flow diagram, Inventory flow chart, Warehouse flowchart, Warehouse management flow chart, Inventory control flowchart, or any other Logistics diagram. Use this solution for logistics planning, to reflect logistics activities and processes of an enterprise or firm, to depict the company's supply chains, to demonstrate the ways of enhancing the economic stability on the market, to realize logistics reforms and effective products' promotion.
"Product life cycle is a business analysis that attempts to identify a set of common stages in the life of commercial products. In other words the 'Product Life cycle' PLC is used to map the lifespan of the product such as the stages through which a product goes during its lifespan. ...
The stages of a product's life cycle... :
1. INTRODUCTION... 2. GROWTH... 3. MATURITY... 4. DECLINE...
The product life cycle is an important concept in marketing. It includes four stages that a product goes through from when it was first thought of until it is eliminated from the industry. Not all products reach this final stage. Some continue to grow and others rise and fall." [Product lifecycle. Wikipedia]
The flow chart example "Product life cycle process" was created using the ConceptDraw PRO diagramming and vector drawing software extended with the Flowcharts solution from the area "What is a Diagram" of ConceptDraw Solution Park.
Flowchart - Product life cycle process

"In mathematics, the Euclidean algorithm, or Euclid's algorithm, is a method for computing the greatest common divisor (GCD) of two (usually positive) integers, also known as the greatest common factor (GCF) or highest common factor (HCF). ...
The GCD of two positive integers is the largest integer that divides both of them without leaving a remainder (the GCD of two integers in general is defined in a more subtle way).
In its simplest form, Euclid's algorithm starts with a pair of positive integers, and forms a new pair that consists of the smaller number and the difference between the larger and smaller numbers. The process repeats until the numbers in the pair are equal. That number then is the greatest common divisor of the original pair of integers.
The main principle is that the GCD does not change if the smaller number is subtracted from the larger number. ... Since the larger of the two numbers is reduced, repeating this process gives successively smaller numbers, so this repetition will necessarily stop sooner or later - when the numbers are equal (if the process is attempted once more, one of the numbers will become 0)." [Euclidean algorithm. Wikipedia]
The flowchart example "Euclidean algorithm" was created using the ConceptDraw PRO diagramming and vector drawing software extended with the Mathematics solution from the Science and Education area of ConceptDraw Solution Park.
Euclid's algorithm flow chart

A five level pyramid model of different types of Information Systems based on the information processing requirement of different levels in the organization. The first level represents transaction processing systems to process basic data. The second level represents office support systems to process information in office. The third level represents management information systems to process information by managers. The fourth level represents decision support systems to process explicit knowledge. The fifth level represents executive information systems to process tacit knowledge.
"A Computer(-Based) Information System is essentially an IS using computer technology to carry out some or all of its planned tasks. The basic components of computer based information system are:
(1) Hardware - these are the devices like the monitor, processor, printer and keyboard, all of which work together to accept, process, show data and information.
(2) Software - are the programs that allow the hardware to process the data.
(3) Databases - are the gathering of associated files or tables containing related data.
(4) Networks - are a connecting system that allows diverse computers to distribute resources.
(5) Procedures - are the commands for combining the components above to process information and produce the preferred output.
The first four components (hardware, software, database and network) make up what is known as the information technology platform. Information technology workers could then use these components to create information systems that watch over safety measures, risk and the management of data. These actions are known as information technology services." [Information systems. Wikipedia]
This pyramid diagram was redesigned using the ConceptDraw PRO diagramming and vector drawing software from Wikimedia Commons file Five-Level-Pyramid-model.png. [commons.wikimedia.org/ wiki/ File:Five-Level-Pyramid-model.png]
This file is licensed under the Creative Commons Attribution 3.0 Unported license. [creativecommons.org/ licenses/ by/ 3.0/ deed.en]
The triangle chart example "Information systems types" is included in the Pyramid Diagrams solution from the Marketing area of ConceptDraw Solution Park.
Pyramid diagram

The vector stencils library "Citric acid cycle (TCA cycle)" contains 26 symbols of metabolites for drawing metabolic pathway maps and biochemical shematic diagrams of the citric acid cycle (TCA cycle, tricarboxylic acid cycle, Krebs cycle) and diagrams of metabolism processes.
"The citric acid cycle - also known as the tricarboxylic acid cycle (TCA cycle), or the Krebs cycle, - is a series of chemical reactions used by all aerobic organisms to generate energy through the oxidation of acetate derived from carbohydrates, fats and proteins into carbon dioxide and chemical energy in the form of adenosine triphosphate (ATP). In addition, the cycle provides precursors of certain amino acids as well as the reducing agent NADH that is used in numerous other biochemical reactions. Its central importance to many biochemical pathways suggests that it was one of the earliest established components of cellular metabolism and may have originated abiogenically.
The name of this metabolic pathway is derived from citric acid (a type of tricarboxylic acid) that is consumed and then regenerated by this sequence of reactions to complete the cycle. In addition, the cycle consumes acetate (in the form of acetyl-CoA) and water, reduces NAD+ to NADH, and produces carbon dioxide as a waste byproduct. The NADH generated by the TCA cycle is fed into the oxidative phosphorylation (electron transport) pathway. The net result of these two closely linked pathways is the oxidation of nutrients to produce usable chemical energy in the form of ATP." [Citric acid cycle. Wikipedia]
The shapes example "Design elements - TCA cycle" is included in the Biology solution from the Science and Education area of ConceptDraw Solution Park.
Tricarboxylic acid cycle (Krebs cycle) symbols
-symbols--design-elements---tca-cycle.png--diagram-flowchart-example.png)
- Flowchart Definition | Process Flow Chart | Flowchart Components ...
- Bio Flowchart | Flow Chart On Components Of Food
- Accounting Information Systems Flowchart Symbols | Flowchart ...
- Flowchart Components | Aerospace and Transport | Flow Chart For ...
- Bio Flowchart | Components Of Food Flow Chart
- UML Class Diagram Example for Transport System | Flowchart ...
- Euclidean algorithm - Flowchart | | Explain Flowchat
- Basic Flowchart Symbols and Meaning | Flowchart Components ...
- Flowchart Components | How to Create a Social Media DFD ...
- Explain Various Components Of Data Communication System With ...
- Flow chart Example. Warehouse Flowchart | Flowchart Components ...
- Flowchart Components | Flowchart design. Flowchart symbols ...
- Basic Flowchart Symbols and Meaning | Flowchart Components ...
- Flow chart Example. Warehouse Flowchart | Simple Flow Chart ...
- Basic Flowchart Symbols and Meaning | Types of Flowcharts ...
- Flow Chart Symbols | Basic Flowchart Symbols and Meaning ...
- Process Flowchart | Cross-Functional Flowchart | Flow chart ...
- List Ten Flowchart Symbols And Their Uses
- Flowchart Definition | Flowchart . What is Flowchart | Flow Chart ...
- Flowchart on Bank. Flowchart Examples | Process Flowchart | UML ...