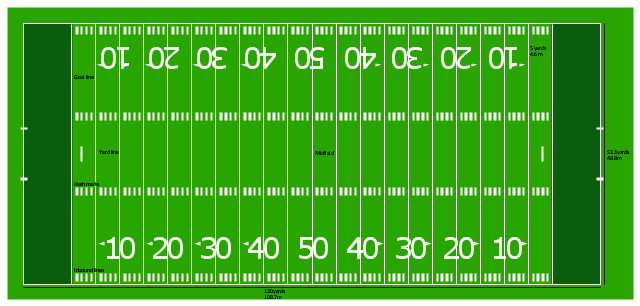
"Football games are played on a rectangular field that measures 120 yards (110 m) long and 53.33 yards (48.76 m) wide. Lines marked along the ends and sides of the field are known respectively as the end lines and side lines, and goal lines are marked 9 yards (8.2 m) outward from each end line. Weighted pylons are placed on the inside corner of the intersections of the goal lines and end lines.
White markings on the field identify the distance from the end zone. Inbound lines, or hash marks, are short parallel lines that mark off 1 yard (0.91 m) increments. Yard lines, which run the width of the field, are marked every 5 yards (4.6 m). A line one yard wide is placed at each end of the field. This line is marked at the center of the two-yard line in professional play and at the three-yard line in college play. Numerals that display the yard lines in multiples of ten are placed along both sides of the field.
Goalposts are at the center of the plane of each of the two end lines. The crossbar of these posts is ten feet (3 meters) above the ground, with vertical uprights at the end of the crossbar 18 feet 6 inches (6 m) apart for professional and collegiate play and 23 feet 4 inches (7 m) apart for high school play. The uprights extend vertically 10 yards on professional fields, a minimum of 10 yards on college fields, and a minimum of ten feet on high school fields. Goal posts are padded at the base, and orange ribbons are normally placed at the tip of each upright." [American football. Wikipedia]
The diagram example "Horizontal colored football field" was created using the ConceptDraw PRO diagramming and vector drawing software extended with the Football solution from the Sport area of ConceptDraw Solution Park.
American football field diagram
Ice Hockey Rink Dimensions

 Football
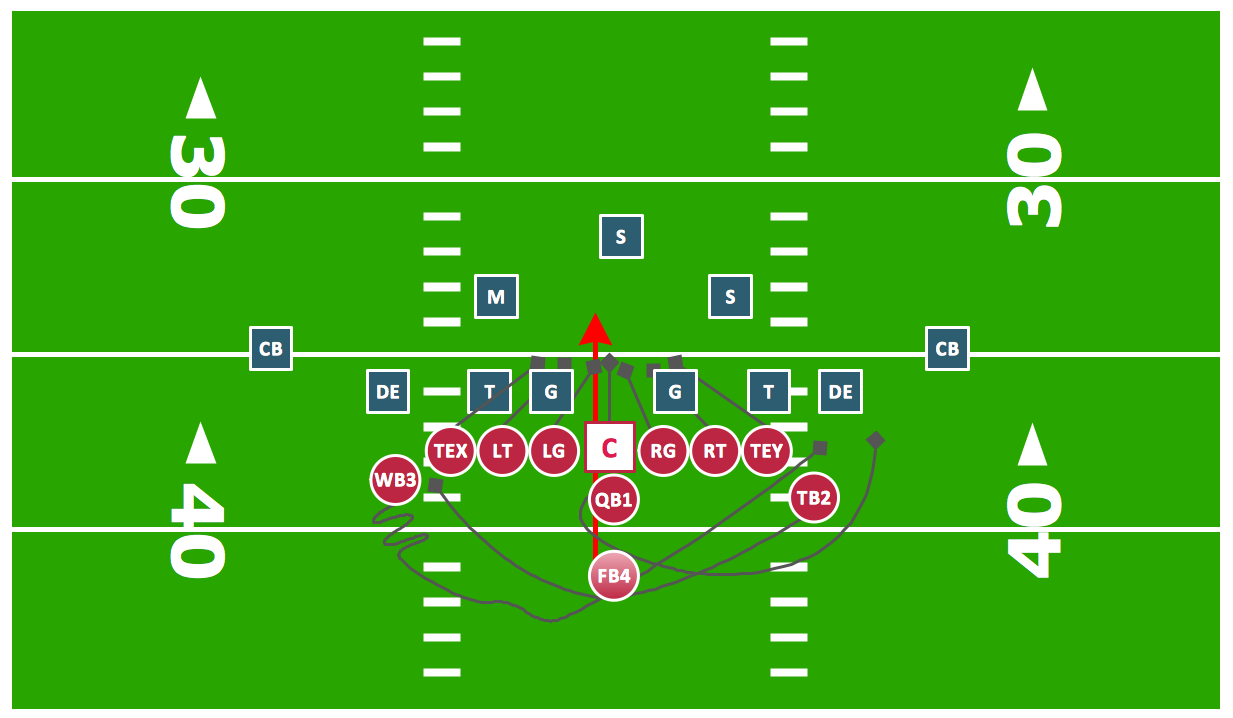
The Football Solution extends ConceptDraw DIAGRAM.5 (or later) software with samples, templates, and libraries of vector objects for drawing football (American) diagrams, plays schemas, and illustrations. It can be used to make professional looking documen
Offensive Play – Double Wing Wedge – Vector Graphic Diagram
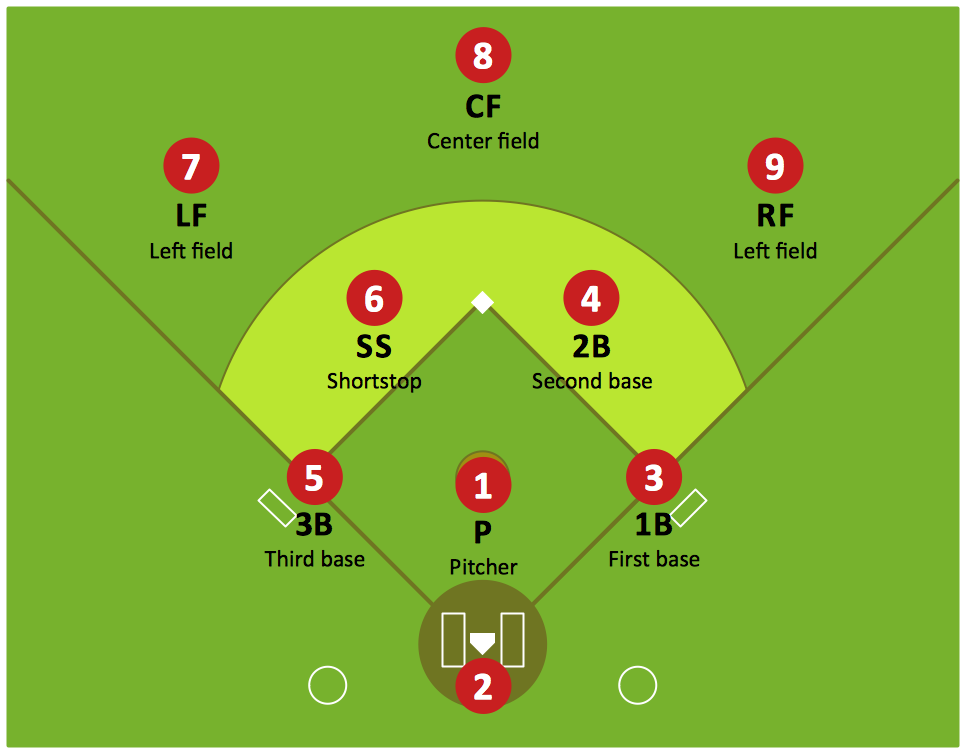
Baseball Diagram — Defence Positions
 Network Layout Floor Plans
Network Layout Floor Plans solution extends ConceptDraw DIAGRAM software functionality with powerful tools for quick and efficient documentation the network equipment and displaying its location on the professionally designed Network Layout Floor Plans. Never before creation of Network Layout Floor Plans, Network Communication Plans, Network Topologies Plans and Network Topology Maps was not so easy, convenient and fast as with predesigned templates, samples, examples and comprehensive set of vector design elements included to the Network Layout Floor Plans solution. All listed types of plans will be a good support for the future correct cabling and installation of network equipment.
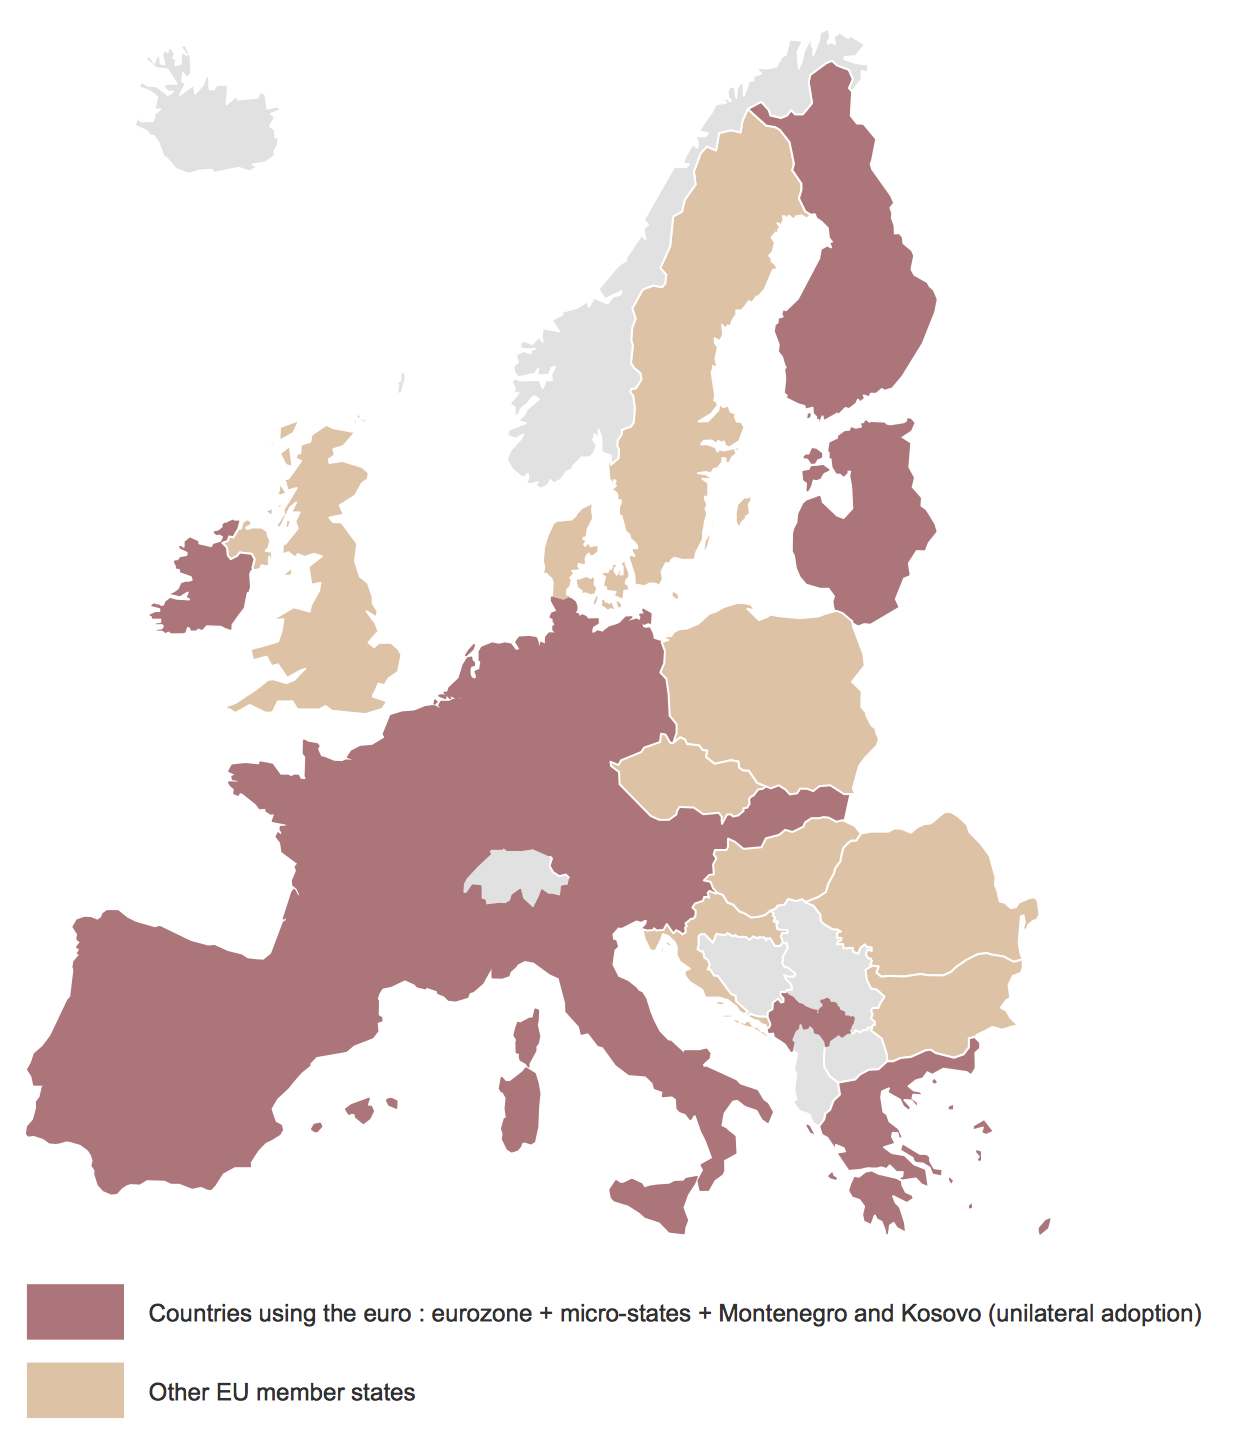
Vector Map of Germany
 Area Charts
Area Charts are used to display the cumulative totals over time using numbers or percentages; or to show trends over time among related attributes. The Area Chart is effective when comparing two or more quantities. Each series of data is typically represented with a different color, the use of color transparency in an object’s transparency shows overlapped areas and smaller areas hidden behind larger areas.
 Specification and Description Language (SDL)
For people in the field of systems engineering or system design, working with specification and description language (sdl) and finite state machines (fsm).
 Seven Basic Tools of Quality
Manage quality control in the workplace, using fishbone diagrams, flowcharts, Pareto charts and histograms, provided by the Seven Basic Tools of Quality solution.
- ( Football ) Field
- Soccer ( Football ) Dimensions | Design a Soccer ( Football ) Field ...
- Diagram Of Football Field With Measurements
- Horizontal colored football field | Association football (soccer) field ...
- Entity-Relationship Diagram (ERD) | Area Charts | Football ...
- Football | Explain College Library Management System Dfd
- Entity-Relationship Diagram (ERD) | Football | Uml Use Case ...
- American Football Field Diagram
- College Management System Prohect Er Diagram In Ppt
- Football field diagram | Soccer ( Football ) Field Templates | Design a ...