Bio Flowchart
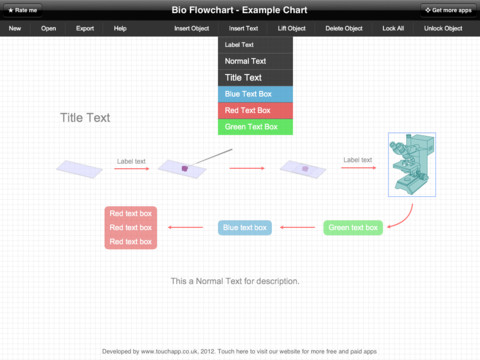
This app targets to help teachers and students to create vivid and professional biological flowcharts and diagrams in an easy way.HelpDesk
How to Draw Biology Diagram in ConceptDraw PRO
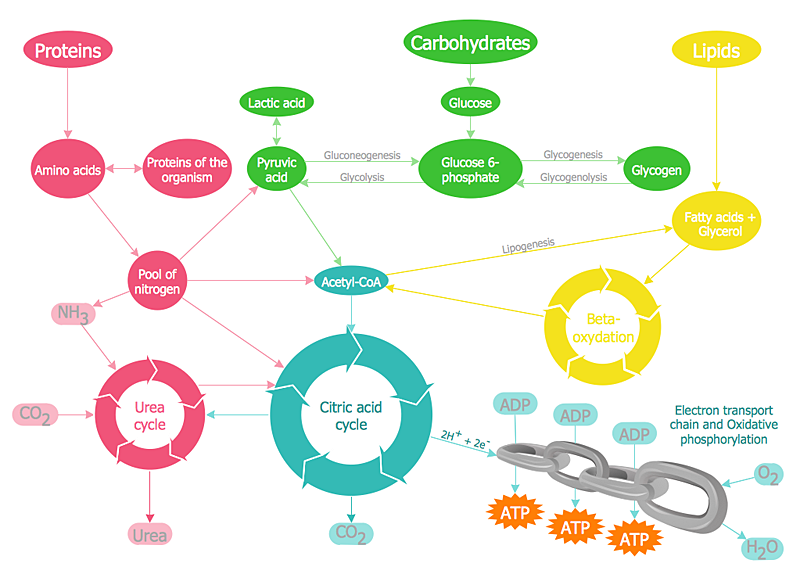
Biology is the science studying the living forms of life. A good starting point when studying biology is to use drawings. Drawings help students to comprehend and remember knowledge that is difficult to explain and understand. Students are used to draw various specific diagrams such as the human circulatory systems or schemes of various biochemical processes. Researchers also need to complete their work with a variety of related diagrams and illustrations. ConceptDraw Biology solution allows you to draw various biological diagrams and schemes easily.
 Logistics Flow Charts
Logistics Flow Charts solution extends ConceptDraw PRO v11 functionality with opportunities of powerful logistics management software. It provides large collection of predesigned vector logistic symbols, pictograms, objects and clipart to help you design with pleasure Logistics flow chart, Logistics process flow diagram, Inventory flow chart, Warehouse flowchart, Warehouse management flow chart, Inventory control flowchart, or any other Logistics diagram. Use this solution for logistics planning, to reflect logistics activities and processes of an enterprise or firm, to depict the company's supply chains, to demonstrate the ways of enhancing the economic stability on the market, to realize logistics reforms and effective products' promotion.
 Pie Charts
Pie Charts are extensively used in statistics and business for explaining data and work results, in mass media for comparison (i.e. to visualize the percentage for the parts of one total), and in many other fields. The Pie Charts solution for ConceptDraw PRO v10 offers powerful drawing tools, varied templates, samples, and a library of vector stencils for simple construction and design of Pie Charts, Donut Chart, and Pie Graph Worksheets.
HelpDesk
How to Draw a Circular Arrows Diagram Using ConceptDraw PRO
The cyclic recurrence is a fundamental property of multiple systems. The cycle is a process which consists from elements (phases, stages, stages) following each other. Many processes in astronomy, biology, chemistry, physics, mathematics, etc. have a cycle properties. It is also widely used in information technologies and marketing analysis. Graphical representation of cyclic processes can have many forms. It can be a circle, parabola, hyperbola, ellipse and others. A Circular Arrows Diagram is used as one of the statistical charts in the business, mass media and marketing. ConceptDraw PRO provides its users tools for making easy drawing Circular Arrows Diagrams.
 ConceptDraw Solution Park
ConceptDraw Solution Park collects graphic extensions, examples and learning materials
 Organizational Charts
Organizational Charts solution extends ConceptDraw PRO software with samples, templates and library of vector stencils for drawing the org charts.
- Biology Chart Work
- Using A Chart Of Any Biology Drawing Represent A Scheme Of Work
- Work Flow Chart | Scientific Symbols Chart | Biology Drawing ...
- Funny animals - Vector stencils library | Biology Drawing Software ...
- Biology Drawing Software | Scientific Symbols Chart | Venn Diagram ...
- Biology Symbols | Biology Drawing Software | Bio Flowchart Lite ...
- Biology | Physics Symbols | Business Diagram Software | Tree Chart ...
- How To Prepare Flow Charts For Biology
- Basic Diagramming Flowchart Software | Bio Flowchart Lite | Biology ...
- Pictorial Chart Of Biology
- Biology | Catabolism schematic - Biochemical diagram | Design ...
- Biology Streams Chart
- Bio Flowchart Lite | Biology | Design elements - Biochemistry of ...
- Biology | Biology Illustration | Business Diagram Software | Flow ...
- Make A Project Biology Chart
- Metabolic pathway map - Biochemical diagram | Biology ...
- Biology Chart And Diagrams
- Biology | Design elements - Biochemistry of metabolism | Biology ...
- Draw The Chart Related To Biology
- Biology Charts


