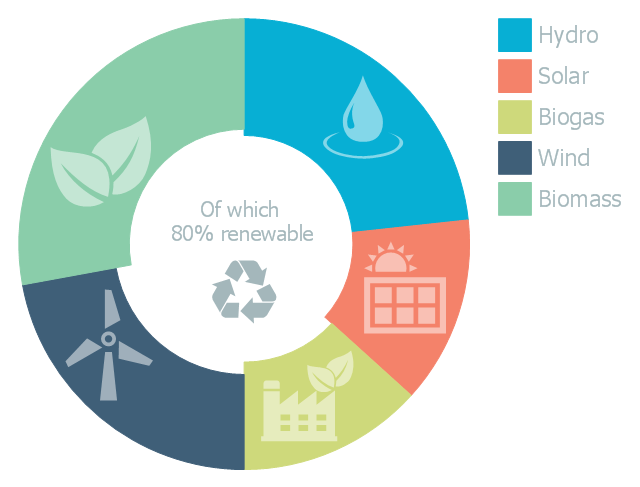
This doughnut chart sample illustrates the renewable energy sources. It was designed on the base of the Wikipedia file: Example of a doughnut chart.png.
[en.wikipedia.org/ wiki/ File:Example_ of_ a_ doughnut_ chart.png]
This file is licensed under the Creative Commons Attribution-ShareAlike 3.0 License. [creativecommons.org/ licenses/ by-sa/ 3.0/ ]
"Renewable energy is generally defined as energy that is collected from resources which are naturally replenished on a human timescale, such as sunlight, wind, rain, tides, waves, and geothermal heat. Renewable energy often provides energy in four important areas: electricity generation, air and water heating/ cooling, transportation, and rural (off-grid) energy services." [Renewable energy. Wikipedia]
The donut chart example "Renewable energy" was created using the ConceptDraw PRO diagramming and vector drawing software extended with the Pie Charts solutiton of the Graphs and Charts area in ConceptDraw Solution Park.
Donut chart
 Pie Charts
Pie Charts are extensively used in statistics and business for explaining data and work results, in mass media for comparison (i.e. to visualize the percentage for the parts of one total), and in many other fields. The Pie Charts solution for ConceptDraw PRO v10 offers powerful drawing tools, varied templates, samples, and a library of vector stencils for simple construction and design of Pie Charts, Donut Chart, and Pie Graph Worksheets.
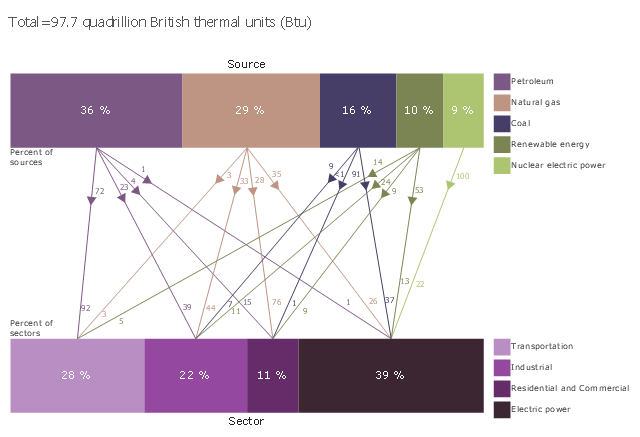
This divided bar diagram sample shows U.S. primary energy consumption by source and sector in 2015. It was designed using data from the chart in the webpage "U.S. Energy Facts Explained, Consumption & Production" on the website of the U.S. Energy Information Administration.
"Americans use many types of energy
Petroleum, natural gas, coal, renewable energy, and nuclear electric power are primary sources of energy. Electricity is a secondary energy source that is generated from primary sources of energy.
Energy sources are measured in different physical units: liquid fuels in barrels or gallons, natural gas in cubic feet, coal in short tons, and electricity in kilowatts and kilowatthours. In the United States, British thermal units (Btu), a measure of heat energy, is commonly used for comparing different types of energy to each other. In 2015, total U.S. primary energy consumption was about 97.7 quadrillion (1015, or one thousand trillion) Btu."
[eia.gov/ energyexplained/ index.cfm?page=us_ energy_ home]
The chart example "U.S. primary energy consumption by source and sector" was created using the ConceptDraw PRO diagramming and vector drawing software extended with the Divided Bar Diagrams solution from the Graphs and Charts area of ConceptDraw Solution Park.
Divided bar chart
Electrical Symbols — Power Sources

 Divided Bar Diagrams
The Divided Bar Diagrams Solution extends the capabilities of ConceptDraw PRO v10 with templates, samples, and a library of vector stencils for drawing high impact and professional Divided Bar Diagrams and Graphs, Bar Diagram Math, and Stacked Graph.
Flow chart Example. Warehouse Flowchart


"Consumption of energy resources, (e.g. turning on a light) requires resources and has an effect on the environment. Many electric power plants burn coal, oil or natural gas in order to generate electricity for energy needs. While burning these fossil fuels produces a readily available and instantaneous supply of electricity, it also generates air pollutants including carbon dioxide (CO2), sulfur dioxide and trioxide (SOx) and nitrogen oxides (NOx). Carbon dioxide is an important greenhouse gas which is thought to be responsible for some fraction of the rapid increase in global warming seen especially in the temperature records in the 20th century, as compared with tens of thousands of years worth of temperature records which can be read from ice cores taken in Arctic regions. Burning fossil fuels for electricity generation also releases trace metals such as beryllium, cadmium, chromium, copper, manganese, mercury, nickel, and silver into the environment, which also act as pollutants.
The large-scale use of renewable energy technologies would "greatly mitigate or eliminate a wide range of environmental and human health impacts of energy use". Renewable energy technologies include biofuels, solar heating and cooling, hydroelectric power, solar power, and wind power. Energy conservation and the efficient use of energy would also help." [Energy industry. Environmental impact. Wikipedia]
The Energy resources diagram example was created in the ConceptDraw PRO diagramming and vector drawing software using the Manufacturing and Maintenance solution from the Illustration area of ConceptDraw Solution Park.
Infographics

 Manufacturing and Maintenance
Manufacturing and maintenance solution extends ConceptDraw PRO software with illustration samples, templates and vector stencils libraries with clip art of packaging systems, industrial vehicles, tools, resources and energy.
- Flow Chart For Renewable And Nonrenewable Resources
- Renewable Energy Detailed Flow Diagram
- Energy resources diagram | Manufacturing and Maintenance | Pie ...
- Pie Chart For Solar Energy
- Examples Of Non Renewable Energy
- A Pictorial Chart Of Renewable Source Of Energy
- Flow Chart On Renewable And Nonrenewable Resources
- Energy resources diagram | Solar Energy Conservation Chart
- Solar Energy Flow Chart