HelpDesk
How to Draw a Сonstellation Сhart

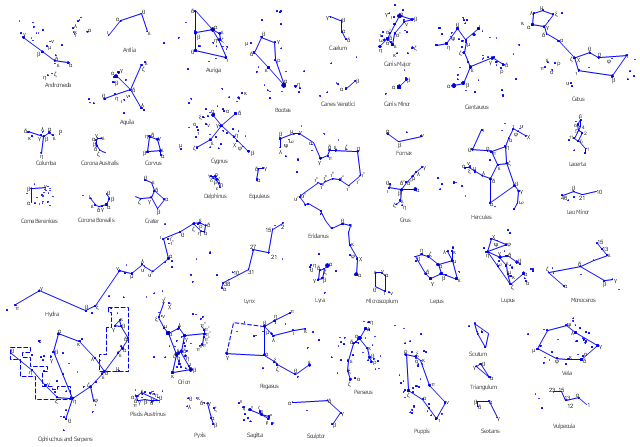
The vector stencils library "Constellations except Zodiac, Northern and Southern" contains 47 star constellation maps.
"A star chart or star map is a map of the night sky. Astronomers divide these into grids to use them more easily. They are used to identify and locate astronomical objects such as stars, constellations and galaxies. They have been used for human navigation since time immemorial. Note that a star chart differs from an astronomical catalog, which is a listing or tabulation of astronomical objects for a particular purpose. A planisphere is a type of star chart." [Star chart. Wikipedia]
The star charts example "Design elements - Constellations except Zodiac, Northern and Southern" was created using the ConceptDraw PRO diagramming and vector drawing software extended with the Astronomy solution from the Science and Education area of ConceptDraw Solution Park.
Star constellation maps
 Pie Charts
Pie Charts are extensively used in statistics and business for explaining data and work results, in mass media for comparison (i.e. to visualize the percentage for the parts of one total), and in many other fields. The Pie Charts solution for ConceptDraw PRO v10 offers powerful drawing tools, varied templates, samples, and a library of vector stencils for simple construction and design of Pie Charts, Donut Chart, and Pie Graph Worksheets.
 Basic Pie Charts
This solution extends the capabilities of ConceptDraw PRO v10.3.0 (or later) with templates, samples, and a library of vector stencils for drawing pie and donut charts.
 Area Charts
Area Charts are used to display the cumulative totals over time using numbers or percentages; or to show trends over time among related attributes. The Area Chart is effective when comparing two or more quantities. Each series of data is typically represented with a different color, the use of color transparency in an object’s transparency shows overlapped areas and smaller areas hidden behind larger areas.
 Organizational Charts
Organizational Charts solution extends ConceptDraw PRO software with samples, templates and library of vector stencils for drawing the org charts.
 Logistics Flow Charts
Logistics Flow Charts solution extends ConceptDraw PRO v11 functionality with opportunities of powerful logistics management software. It provides large collection of predesigned vector logistic symbols, pictograms, objects and clipart to help you design with pleasure Logistics flow chart, Logistics process flow diagram, Inventory flow chart, Warehouse flowchart, Warehouse management flow chart, Inventory control flowchart, or any other Logistics diagram. Use this solution for logistics planning, to reflect logistics activities and processes of an enterprise or firm, to depict the company's supply chains, to demonstrate the ways of enhancing the economic stability on the market, to realize logistics reforms and effective products' promotion.
HelpDesk
How to Create Organizational Chart Quickly

- Flowchart Software | Astronomy | Pie Chart Software | Download ...
- Constellation Chart | How to Draw a Сonstellation Сhart | Illustration ...
- Astronomy Easy Pictures Of Chart
- Atmosphere air composition | Scientific Symbols Chart | Astronomy ...
- Constellation Chart | Illustration Software | Astronomy | Orion Symbol
- Constellation Chart | Astronomy and Astrology | Sketching Software ...
- Constellation Chart | Sketching Software | Astronomy | Constellation ...
- Constellation Chart | Illustration Software | Astronomy | Orion ...
- Constellation Chart | Astronomy | Sun Solar System | The Expanse ...
- Astronomy Symbols | Zodiac constellations - Vector stencils library ...
- Constellation Chart | Astronomy Symbols | Solar System Symbols ...
- Basic Flowchart Symbols and Meaning | Bubble Chart | Astronomy ...
- Constellation Chart | Illustration Software | Astronomy | Orion Symbols
- How to Draw a Сonstellation Сhart | Constellation Chart | Astronomy ...
- Physics Symbols | Astronomy Symbols | Constellation Chart | Charts ...
- Constellation Chart | Sketching Software | Illustration Software ...
- Sketching Software | Constellation Chart | Astronomy and Astrology ...
- Astronomy Symbols | Spider Chart Template | Create Beautiful ...
- Line Chart Template for Word | Scientific Symbols Chart | Astronomy ...
- Sun Solar System | Astronomy Symbols | Sketching Software | Chart ...