"Causes in the diagram are often categorized, such as to the 6 M's ...
The 6 Ms (used in manufacturing industry):
(1) Machine (technology);
(2) Method (process);
(3) Material (Includes Raw Material, Consumables and Information.);
(4) Man Power (physical work)/ Mind Power (brain work): Kaizens, Suggestions;
(5) Measurement (Inspection);
(6) Milieu/ Mother Nature (Environment).
The original 6Ms used by the Toyota Production System have been expanded by some to include the following and are referred to as the 8Ms. However, this is not globally recognized. It has been suggested to return to the roots of the tools and to keep the teaching simple while recognizing the original intent; most programs do not address the 8Ms.
(7) Management/ Money Power;
(8) Maintenance." [Ishikawa diagram. Wikipedia]
This 8Ms Ishikawa diagram (manufacturing cause and effect diagram) template is included in the Fishbone Diagram solution from the Management area of ConceptDraw Solution Park.
8Ms Ishikawa diagram

 Fishbone Diagram
Fishbone Diagrams solution extends ConceptDraw PRO software with templates, samples and library of vector stencils for drawing the Ishikawa diagrams for cause and effect analysis.
Process Flowchart


Fault Tree Analysis Software

 Engineering
This solution extends ConceptDraw PRO v9.4 with the ability to visualize industrial systems in electronics, electrical, chemical, process, and mechanical engineering.
 Entity-Relationship Diagram (ERD)
Entity-Relationship Diagram (ERD) solution extends ConceptDraw PRO software with templates, samples and libraries of vector stencils from drawing the ER-diagrams by Chen's and crow’s foot notations.
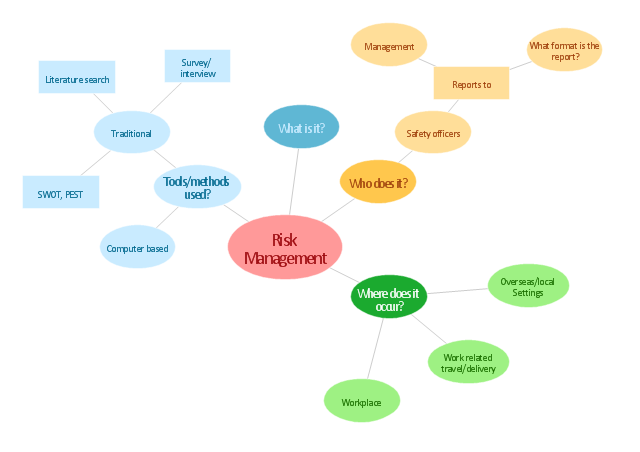
"Risk management is the identification, assessment, and prioritization of risks (defined in ISO 31000 as the effect of uncertainty on objectives, whether positive or negative) followed by coordinated and economical application of resources to minimize, monitor, and control the probability and/ or impact of unfortunate events or to maximize the realization of opportunities. Risks can come from uncertainty in financial markets, threats from project failures (at any phase in design, development, production, or sustainment life-cycles), legal liabilities, credit risk, accidents, natural causes and disasters as well as deliberate attack from an adversary, or events of uncertain or unpredictable root-cause. ... Methods, definitions and goals vary widely according to whether the risk management method is in the context of project management, security, engineering, industrial processes, financial portfolios, actuarial assessments, or public health and safety.
The strategies to manage threats (uncertainties with negative consequences) typically include transferring the threat to another party, avoiding the threat, reducing the negative effect or probability of the threat, or even accepting some or all of the potential or actual consequences of a particular threat, and the opposites for opportunities (uncertain future states with benefits)." [Risk management. Wikipedia]
The concept map example "Risk management" was created using the ConceptDraw PRO diagramming and vector drawing software extended with the Concept Maps solution from the area "What is a Diagram" of ConceptDraw Solution Park.
Concept map
- Manufacturing 8 Ms fishbone diagram - Template
- Fishbone Diagram | Manufacturing 8 Ms fishbone diagram ...
- Business Productivity Diagramming | Manufacturing 8 Ms fishbone ...
- Manufacturing 8 Ms fishbone diagram - Template | Business ...
- Process Flowchart | 4 Ms fishbone diagram - Production process ...
- Manufacturing 8 Ms fishbone diagram - Template | Data Flow ...
- Using Fishbone Diagrams for Problem Solving | Cause and Effect ...
- Ishikawa Diagram | 4 Ms fishbone diagram - Production process ...
- Fishbone Diagram | Fishbone Diagrams | Business Productivity ...
- Manufacturing 8 Ms fishbone diagram - Template | Manufacturing ...
- Business Productivity Diagramming | Manufacturing 8 Ms fishbone ...
- Cause And Effect Diagram Examples In Manufacturing
- Value-Stream Mapping for Manufacturing | Business Productivity ...
- Fishbone diagram - Template | Manufacturing 8 Ms fishbone ...
- Manufacturing 8 Ms fishbone diagram - Template | Ishikawa ...
- Manufacturing 8 Ms fishbone diagram - Template | 4 Ms fishbone ...
- Fishbone Diagram | Fishbone diagram - Template | Business ...
- Manufacturing 8 Ms fishbone diagram - Template | Manufacturing 8 ...
- Fishbone Diagram | Design elements - Fishbone diagram ...
- Fishbone Diagram | Business Productivity Diagramming | Cause ...