This SWOT matrix diagram example was created on the base of article "An Easy Way To Jumpstart Your Strategic Plan: SWOT" by Leslie Wolf from the website of the California Digital Library, the University of California. "Strategic planning doesn’t have to be a daunting and lengthy process. The goal is really a simple one: to help you understand your world and build a road map to guide your efforts. ...
This analysis tool can help you focus your attention on the specific success factors that are right for your team.
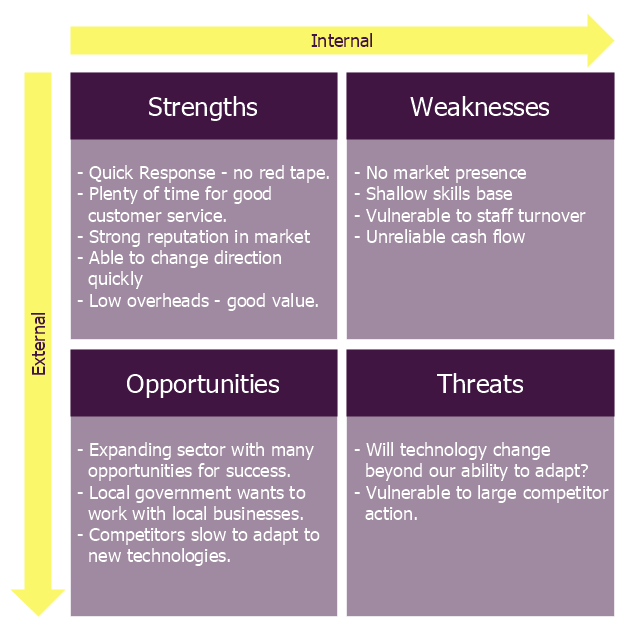
The tool is called a SWOT analysis. SWOT stands for Strengths and Weaknesses, Opportunities and Threats. Here’s what it means:
(1) Strengths are those positive internal attributes that strengthen your business or team. You can develop plans to capitalize on those strengths.
(2) Weaknesses are those negative internal attributes that are working against your success. You can shore up those weaknesses so they don’t stop your success.
(3) Opportunities are those external conditions that can have a positive effect on your goals. These opportunities can point you in the right direction.
(4) Threats are those external conditions that can have a negative effect on your goals. These threats will affect you less if you can identify and minimize them. ...
We thought it would be helpful to show you a sample SWOT analysis for a business you can easily visualize: a small independent bookstore in a university town. The store owner brought the team together to think about how the bookstore could survive during the continuing financial downturn. After an hour of brainstorming, this is the SWOT analysis they developed." [cdlib.org/ cdlinfo/ 2010/ 09/ 29/ an-easy-way-to-jumpstart-your-strategic-plan-swot/ ]
The matrix diagram example "SWOT analysis for a small independent bookstore" was created using the ConceptDraw PRO diagramming and vector drawing software extended with the SWOT Analysis solution from the Management area of ConceptDraw Solution Park.
This analysis tool can help you focus your attention on the specific success factors that are right for your team.
The tool is called a SWOT analysis. SWOT stands for Strengths and Weaknesses, Opportunities and Threats. Here’s what it means:
(1) Strengths are those positive internal attributes that strengthen your business or team. You can develop plans to capitalize on those strengths.
(2) Weaknesses are those negative internal attributes that are working against your success. You can shore up those weaknesses so they don’t stop your success.
(3) Opportunities are those external conditions that can have a positive effect on your goals. These opportunities can point you in the right direction.
(4) Threats are those external conditions that can have a negative effect on your goals. These threats will affect you less if you can identify and minimize them. ...
We thought it would be helpful to show you a sample SWOT analysis for a business you can easily visualize: a small independent bookstore in a university town. The store owner brought the team together to think about how the bookstore could survive during the continuing financial downturn. After an hour of brainstorming, this is the SWOT analysis they developed." [cdlib.org/ cdlinfo/ 2010/ 09/ 29/ an-easy-way-to-jumpstart-your-strategic-plan-swot/ ]
The matrix diagram example "SWOT analysis for a small independent bookstore" was created using the ConceptDraw PRO diagramming and vector drawing software extended with the SWOT Analysis solution from the Management area of ConceptDraw Solution Park.
SWOT matrix

This SWOT matrix diagram example was created on the base of article "An Easy Way To Jumpstart Your Strategic Plan: SWOT" by Leslie Wolf from the website of the California Digital Library, the University of California. "Strategic planning doesn’t have to be a daunting and lengthy process. The goal is really a simple one: to help you understand your world and build a road map to guide your efforts. ...
This analysis tool can help you focus your attention on the specific success factors that are right for your team.
The tool is called a SWOT analysis. SWOT stands for Strengths and Weaknesses, Opportunities and Threats. Here’s what it means:
(1) Strengths are those positive internal attributes that strengthen your business or team. You can develop plans to capitalize on those strengths.
(2) Weaknesses are those negative internal attributes that are working against your success. You can shore up those weaknesses so they don’t stop your success.
(3) Opportunities are those external conditions that can have a positive effect on your goals. These opportunities can point you in the right direction.
(4) Threats are those external conditions that can have a negative effect on your goals. These threats will affect you less if you can identify and minimize them. ...
We thought it would be helpful to show you a sample SWOT analysis for a business you can easily visualize: a small independent bookstore in a university town. The store owner brought the team together to think about how the bookstore could survive during the continuing financial downturn. After an hour of brainstorming, this is the SWOT analysis they developed." [cdlib.org/ cdlinfo/ 2010/ 09/ 29/ an-easy-way-to-jumpstart-your-strategic-plan-swot/ ]
The matrix diagram example "SWOT analysis for a small independent bookstore" was created using the ConceptDraw PRO diagramming and vector drawing software extended with the SWOT Analysis solution from the Management area of ConceptDraw Solution Park.
SWOT matrix
HelpDesk
How to Make SWOT Analysis in a Word Document

"The name says it: Strength, Weakness, Opportunity, Threat. A SWOT analysis guides you to identify the positives and negatives inside your organization (S-W) and outside of it, in the external environment (O-T). Developing a full awareness of your situation can help with both strategic planning and decision-making.
The SWOT method (which is sometimes called TOWS) was originally developed for business and industry, but it is equally useful in the work of community health and development, education, and even personal growth.
SWOT is not the only assessment technique you can use, but is one with a long track record of effectiveness. The strengths of this method are its simplicity and application to a variety of levels of operation." [ctb.ku.edu/ en/ table-of-contents/ assessment/ assessing-community-needs-and-resources/ swot-analysis/ main]
The diagram example "Small business consultancy SWOT analysis matrix" was created using the ConceptDraw PRO diagramming and vector drawing software extended with the SWOT Analysis solution from the Management area of ConceptDraw Solution Park.
SWOT matrix
Total Quality Management with ConceptDraw
 method - Fishbone diagram template")
 Fishbone Diagram
Fishbone Diagrams solution extends ConceptDraw PRO software with templates, samples and library of vector stencils for drawing the Ishikawa diagrams for cause and effect analysis.
 Audit Flowcharts
Audit flowcharts solution extends ConceptDraw PRO software with templates, samples and library of vector stencils for drawing the audit and fiscal flow charts.
 Active Directory Diagrams
Active Directory Diagrams solution significantly extends the capabilities of ConceptDraw PRO software with special Active Directory samples, convenient template and libraries of Active Directory vector stencils, common icons of sites and services, icons of LDPA elements, which were developed to help you in planning and modelling network structures and network topologies, in designing excellently looking Active Directory diagrams, Active Directory Structure diagrams, and Active Directory Services diagram, which are perfect way to visualize detailed structures of Microsoft Windows networks, Active Directory Domain topology, Active Directory Site topology, Organizational Units (OU), and Exchange Server organization.
 Event-driven Process Chain Diagrams
Event-driven Process Chain (EPC) Diagram is a type of flowchart widely used for modeling in business engineering and reengineering, business process improvement, and analysis. EPC method was developed within the Architecture of Integrated Information Systems (ARIS) framework.
- SWOT analysis for a small independent bookstore | Pandayan ...
- SWOT Analysis | SWOT analysis for a small independent bookstore ...
- SWOT analysis for a small independent bookstore | SWOT Analysis ...
- SWOT analysis for a small independent bookstore | Sales Process ...
- SWOT analysis for a small independent bookstore | What is SWOT ...
- SWOT analysis for a small independent bookstore | SWOT and ...
- SWOT analysis for a small independent bookstore | SWOT and ...
- SWOT analysis for a small independent bookstore
- SWOT analysis for a small independent bookstore | SWOT Analysis ...
- SWOT analysis for a small independent bookstore | Swot Analysis ...
- Competitor Analysis | SWOT analysis for a small independent ...
- SWOT analysis for a small independent bookstore | SWOT analysis ...
- SWOT analysis for a small independent bookstore | Small business ...
- SWOT analysis for a small independent bookstore | Example of DFD ...
- SWOT analysis for a small independent bookstore | SWOT Matrix ...
- SWOT Analysis | SWOT analysis for a small independent bookstore ...
- SWOT analysis for a small independent bookstore | New business ...
- SWOT analysis for a small independent bookstore | SWOT Sample ...
- SWOT analysis for a small independent bookstore | How To use ...
- SWOT analysis for a small independent bookstore | Competitor ...