HelpDesk
How to Create Infographics that Help People Eat Healthy
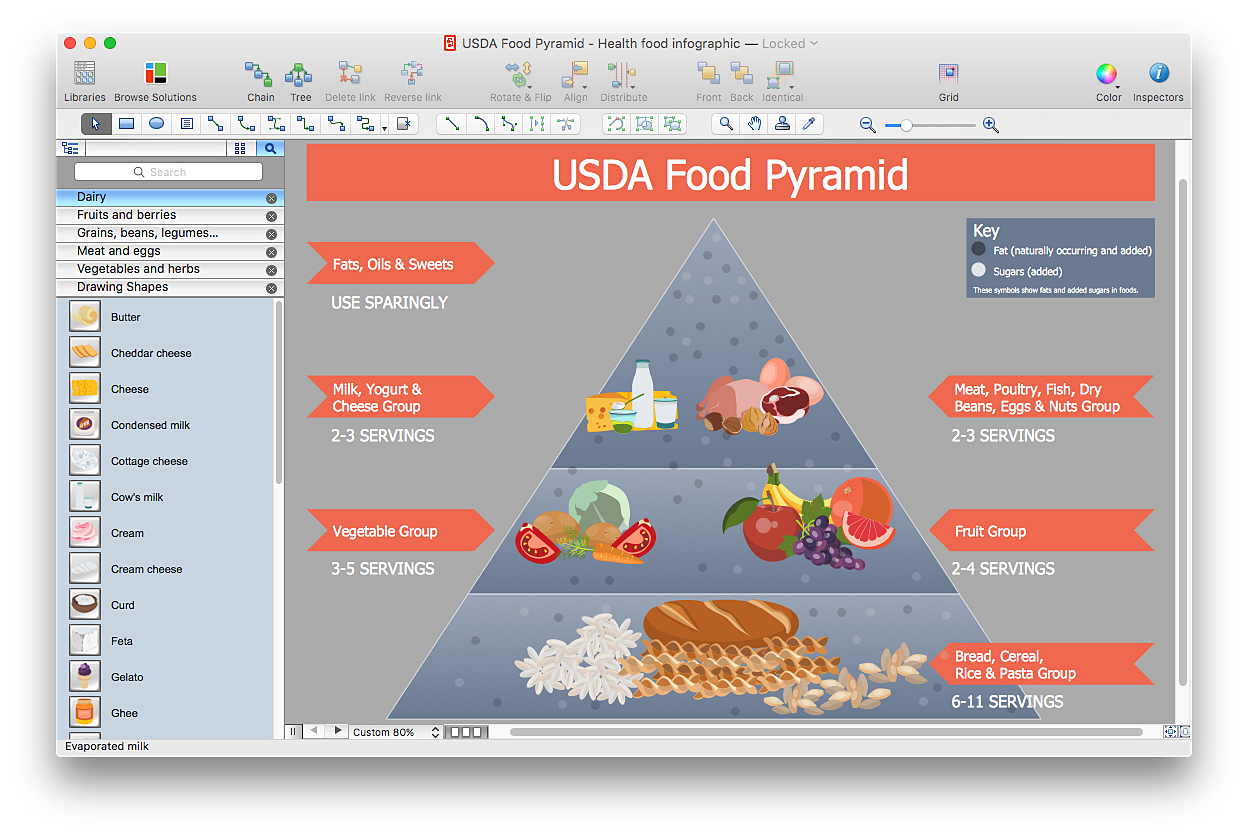
The most effective manner of presenting information on healthy diet and food nutrition is using various visualizations such as charts or infographics. To help easily create infographics and diagrams of healthy eating, ConceptDraw has provided the Health Food solution to its Solution Park. It contains vector stencil libraries of healthy eating options, samples of diagrams and infographics, and a set of templates to help you create your own diagrams, infographics and even adds. Using ConceptDraw PRO you can easily create and share healthy food recipes and materials about the proper nutrition.HelpDesk
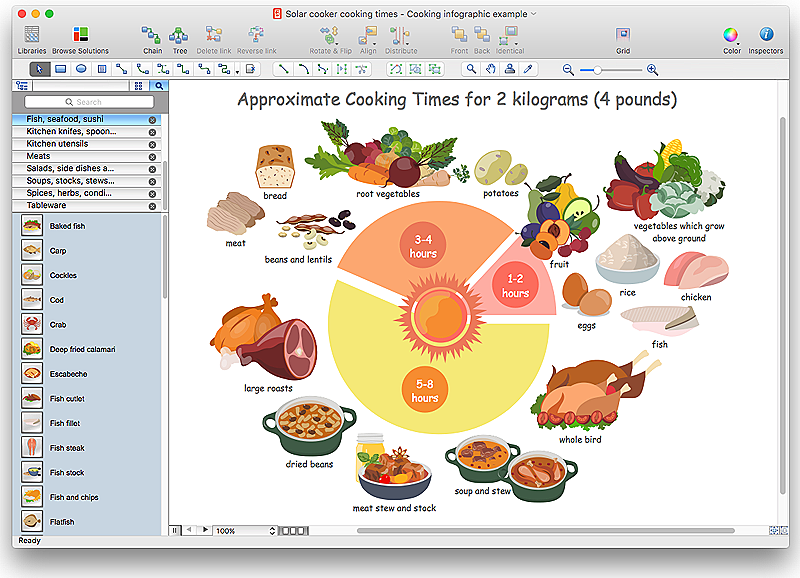
How to Design a Food-related Infographics Using ConceptDraw PRO
Today a large piece of business is referred to a food. This business can not be imagined without various kinds of visualizations. You can see them everywhere — on brand logos, in advertising, on menus and in flyers. Also different food related infographics is used to promote healthy nutrition and to deliver information on how to maintain an effective diet. ConceptDraw Cooking Recipes solution, offers a great collection of bright food-related images and icons, placed into themed libraries. It can be used for catering menu graphics, on marketing flyers, or as concomitant text for infographics.
 Security and Access Plans
This solution extends ConceptDraw PRO software with physical security plan, security chart, access chart, security plans, access schemes, access plans , CCTV System Plan samples, templates and libraries of design elements for drawing the Security and Acce
 Value Stream Mapping
Value stream mapping solution extends ConceptDraw PRO software with templates, samples and vector stencils for drawing the Value Stream Maps (VSM) in lean manufacturing practice.
 Seven Basic Tools of Quality
Manage quality control in the workplace, using fishbone diagrams, flowcharts, Pareto charts and histograms, provided by the Seven Basic Tools of Quality solution.
 Total Quality Management TQM Diagrams
Total Quality Management Diagrams solution extends ConceptDraw PRO software with samples, templates and vector stencils library for drawing the TQM flowcharts.
 Mechanical Engineering
This solution extends ConceptDraw PRO v.9 mechanical drawing software (or later) with samples of mechanical drawing symbols, templates and libraries of design elements, for help when drafting mechanical engineering drawings, or parts, assembly, pneumatic,
 Quality Mind Map
This solution extends ConceptDraw MINDMAP software with Quality Management Mind Maps (Presentations, Meeting Agendas, Problem to be solved).
- Draw A Flow Chart Of Food And Beverage Control
- Food and Beverage | F&B | How to Create Infographics that Help ...
- Sample Of Pareto Chart In Food And Beverage
- Flow chart Example. Warehouse Flowchart | Basic Flowchart ...
- Draw A Flow Chart In Apples Fast Food
- Food and Beverage | How to Create Infographics that Help People ...
- Chemical and Process Engineering | Design elements - Chemical ...
- Draw An Organizational Chart Of Food And Beverages Production
- Picture Graphs | ConceptDraw Solution Park | Group Collaboration ...
- Process Flowchart | Mechanical Drawing Symbols | Design ...
- Chemical and Process Engineering | Process Flowchart | How to ...
- Process Flowchart | Chemical and Process Engineering | How to ...
- Design elements - Chemical engineering | Chemical and Process ...
- Basic Flowchart Symbols and Meaning
- Process Flowchart | Design elements - Industrial equipment | Design ...
- How to Draw a Chemical Process Flow Diagram | Chemical and ...
- Process Flowchart | How to Draw a Process Flow Diagram in ...
- Process Flowchart | Flow chart Example. Warehouse Flowchart ...
- Process Flowchart | Design elements - Industrial equipment ...
- Fishbone Diagram | Business Productivity Diagramming | Business ...

