The vector stencils library "Sales dashboard" contains 27 charts and graphic indicators.
Use it for drawing sales dashboards in the ConceptDraw PRO diagramming and vector drawing software extended with the Sales Dashboard solution from the Marketing area of ConceptDraw Solution Park.
Use it for drawing sales dashboards in the ConceptDraw PRO diagramming and vector drawing software extended with the Sales Dashboard solution from the Marketing area of ConceptDraw Solution Park.
Column Chart

Bar Chart

Line Chart

Divided Bar

Pie Chart

Two Bubbles Indicator

Speedometer Gauge 1

Speedometer Gauge 2

Speedometer Gauge 3

Speedometer Gauge 4

Slider Horizontal 1

Slider Horizontal 2

Slider Horizontal 3

Slider Horizontal 4

Slider Horizontal 5

Slider Horizontal 6

Slider Horizontal 7

Slider Vertical 1

Slider Vertical 2

Slider Vertical 3

Bullet 1

Bullet 2

Bullet 3

Bullet 4

Backgroung 1

Backgroung 2

Backgroung 3

The vector stencils library "Sales dashboard" contains 27 charts and graphic indicators.
Use it for drawing sales dashboards in the ConceptDraw PRO diagramming and vector drawing software extended with the Sales Dashboard solution from the Marketing area of ConceptDraw Solution Park.
Use it for drawing sales dashboards in the ConceptDraw PRO diagramming and vector drawing software extended with the Sales Dashboard solution from the Marketing area of ConceptDraw Solution Park.
Column Chart
Bar Chart
Line Chart
Divided Bar
Pie Chart
Two Bubbles Indicator
Speedometer Gauge 1
Speedometer Gauge 2
Speedometer Gauge 3
Speedometer Gauge 4
Slider Horizontal 1
Slider Horizontal 2
Slider Horizontal 3
Slider Horizontal 4
Slider Horizontal 5
Slider Horizontal 6
Slider Horizontal 7
Slider Vertical 1
Slider Vertical 2
Slider Vertical 3
Bullet 1
Bullet 2
Bullet 3
Bullet 4
Backgroung 1
Backgroung 2
Backgroung 3
The vector stencils library "Meter indicators" contains 29 Live Objects: speedometer gauge, dial, bullet graph, slider and level meter visual indicators.
The Live Objects designed to display actual measures of performance metrics and KPIs from external data source files.
Some of them also display comparative measures, and colored zones of qualitative ranges with legend.
Use it to draw business performance dashboards using the ConceptDraw PRO diagramming and vector drawing software .
"Digital dashboards may be laid out to track the flows inherent in the business processes that they monitor. Graphically, users may see the high-level processes and then drill down into low level data. This level of detail is often buried deep within the corporate enterprise and otherwise unavailable to the senior executives. ...
Specialized dashboards may track all corporate functions. Examples include human resources, recruiting, sales, operations, security, information technology, project management, customer relationship management and many more departmental dashboards. ...
Like a car's dashboard (or control panel), a software dashboard provides decision makers with the input necessary to "drive" the business. Thus, a graphical user interface may be designed to display summaries, graphics (e.g., bar charts, pie charts, bullet graphs, "sparklines," etc.), and gauges (with colors similar to traffic lights) in a portal-like framework to highlight important information. ...
Digital dashboards allow managers to monitor the contribution of the various departments in their organization. To gauge exactly how well an organization is performing overall, digital dashboards allow you to capture and report specific data points from each department within the organization, thus providing a "snapshot" of performance." [Dashboard (management information systems). Wikipedia]
The example "Design elements - Meter indicators" is included in the Meter Dashboard solution from the area "What is a Dashboard" of ConceptDraw Solution Park.
Visual indicators

This sales performance dashboard example includes KPIs indicators and business metrics charts: bullet indicator - "Win Ratio vs. Last Year", gauge (speedometer) indicators - "Open Deals vs. Last Year" and "YTD Sales vs. Last Year", column chart - "Leads created", line chart - "Opportunities Won", alarm indicators - "Sales Ratios", horizontal bar chart - "Top Products in Revenue".
The example "Sales performance dashboard" was created using the ConceptDraw PRO diagramming and vector drawing software extended with the Sales Dashboard solution from the Marketing area of ConceptDraw Solution Park.
www.conceptdraw.com/ solution-park/ marketing-sales-dashboard
The example "Sales performance dashboard" was created using the ConceptDraw PRO diagramming and vector drawing software extended with the Sales Dashboard solution from the Marketing area of ConceptDraw Solution Park.
www.conceptdraw.com/ solution-park/ marketing-sales-dashboard
Sales dashboard

The vector stencils library "Sales KPIs and Metrics" contains 15 chart templates and graphic indicators of sales key performance indicators (KPIs) and metrics.
Use it for drawing sales dashboards in the ConceptDraw PRO diagramming and vector drawing software extended with the Sales Dashboard solution from the Marketing area of ConceptDraw Solution Park.
Use it for drawing sales dashboards in the ConceptDraw PRO diagramming and vector drawing software extended with the Sales Dashboard solution from the Marketing area of ConceptDraw Solution Park.
Actual vs Plan

Average Purchase Value

Clicks from Sales Follow-Up Emails

Cost per customer

Cost per order

Lead Response Time

Opportunity-to-Win Ratio

Product mix

Product Performance

Rate of Contact

Rate of Follow Up Contact

Sales Growth

Sales Target

Social Media Usage

Usage Rate of Marketing Collateral

The vector stencils library "Sales KPIs and Metrics" contains 15 chart templates and graphic indicators of sales key performance indicators (KPIs) and metrics for drawing sales dashboards: line charts "Cost per order" and "Clicks from Sales Follow-Up Emails", column charts "Social Media Usage" and "Usage Rate of Marketing Collateral", horizontal bar charts "Rate of Follow Up Contact", "Cost per customer" and "Lead Response Time", pie charts "Product mix", "Product Performance" and "Rate of Contact", gauge (speedometer) indicators "Sales Growth" and "Actual vs Plan", bullet indicator "Sales Target", diamond alarm indicators "Average Purchase Value", "Quote to Close Ratio", "Opportunity-to-Win Ratio" and "Sales Ratio".
The dashboard charts and indicators example "Design elements - Sales KPIs and metrics" for the ConceptDraw PRO diagramming and vector drawing software is included in the Sales Dashboard solution from the Marketing area of ConceptDraw Solution Park.
www.conceptdraw.com/ solution-park/ marketing-sales-dashboard
Sales dashboard charts and graphic indicators

 Meter Dashboard
Meter dashboard solution extends ConceptDraw PRO software with templates, samples and vector stencils library with meter indicators for drawing visual dashboards showing quantitative data.
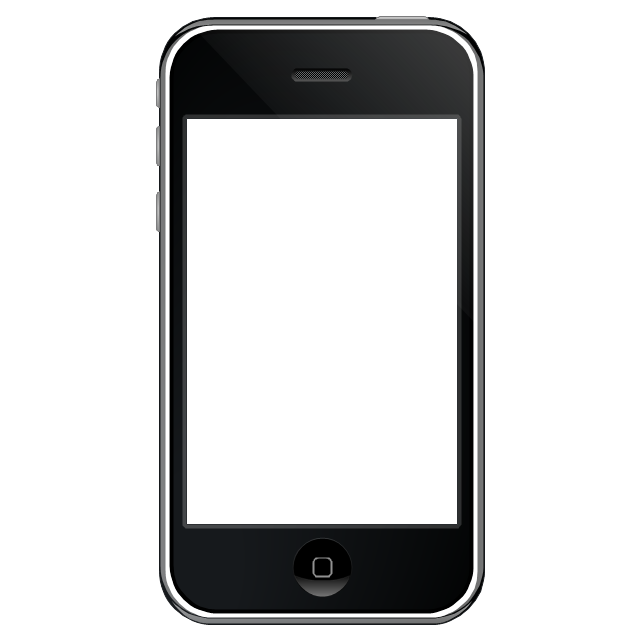
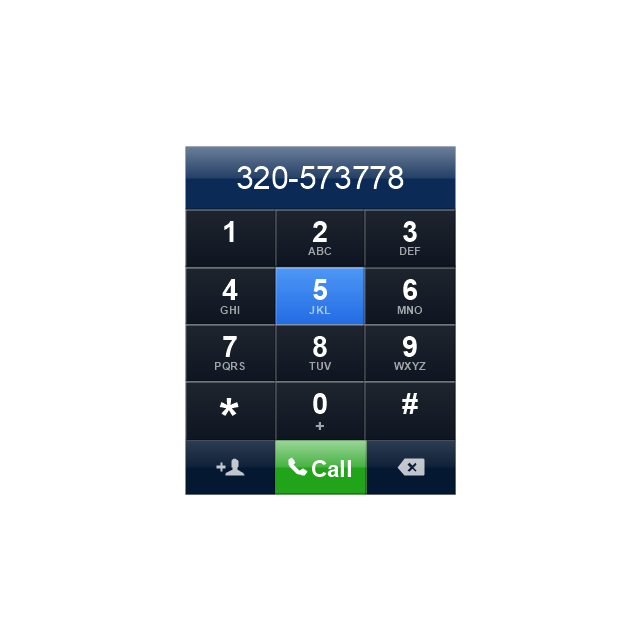
The vector stencils library "iPhone interface" contains 119 iPhone UI design elements.
Use it for development of graphic user interface (GUI) for iPhone software applications in the ConceptDraw PRO diagramming and vector drawing software extended with the Graphic User Interface solution from the Software Development area of ConceptDraw Solution Park.
Use it for development of graphic user interface (GUI) for iPhone software applications in the ConceptDraw PRO diagramming and vector drawing software extended with the Graphic User Interface solution from the Software Development area of ConceptDraw Solution Park.
iPhone case
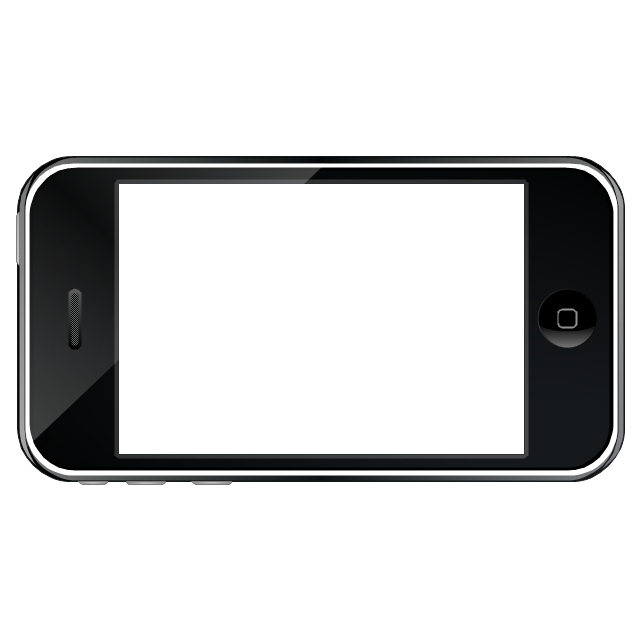
iPhone case, horizontal
Display
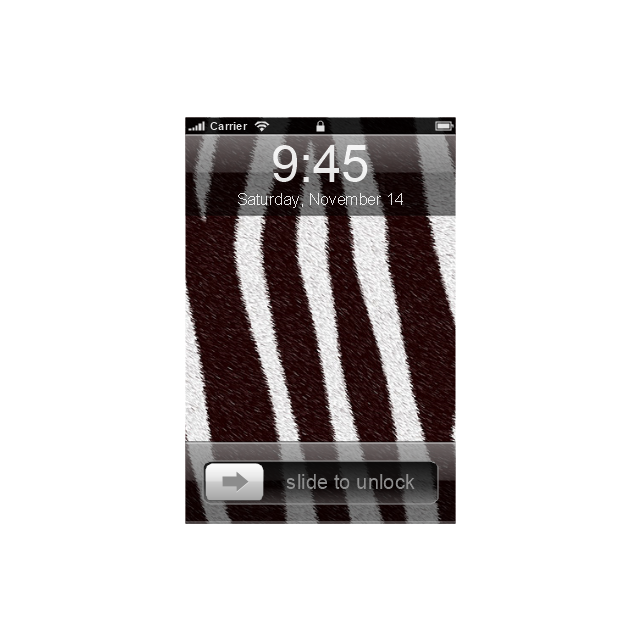
Screen

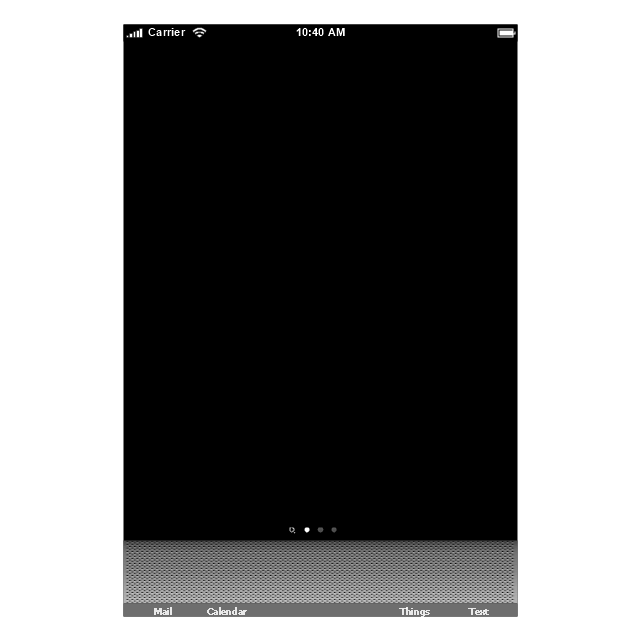
Home screen
Keypad control
Status bar
Navigation bar
Navigation bar with buttons
Navigation bar with controls
Navigation bar with controls
Navigation bar with buttons, horizontal
Navigation bar with controls, horizontal
Modal view
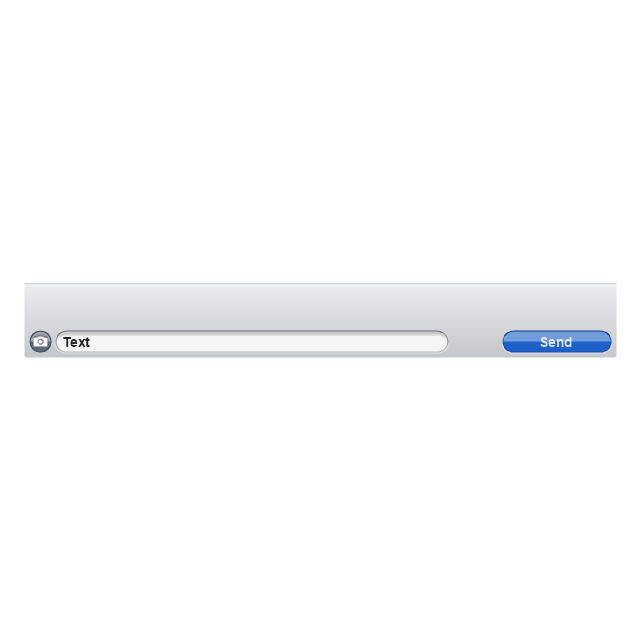
Search bar
Text field 1

Text field 2
Text field, varying
Table row
Table view row
Table view (simple list)
-iphone-interface---vector-stencils-library.png--diagram-flowchart-example.png)
Table view (with header)
-iphone-interface---vector-stencils-library.png--diagram-flowchart-example.png)
Action list
Control button
Navigational control button

Add button

Navigation toolbar

Tab bar

Action sheet

Choice button
Rounded rectangle button
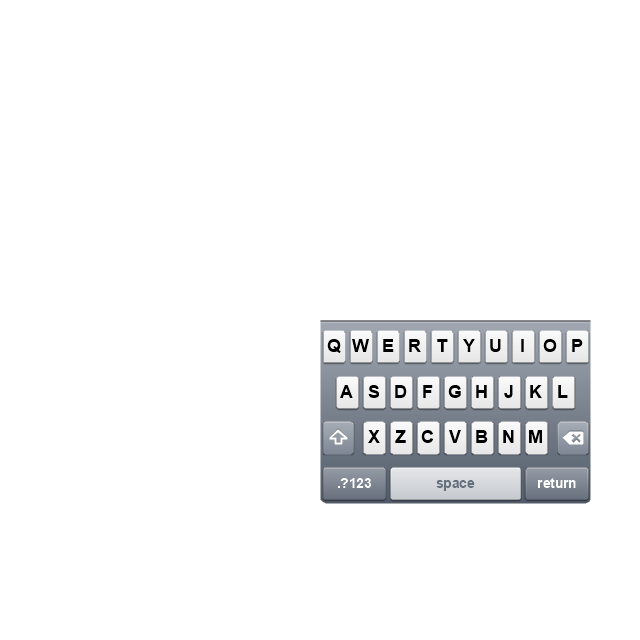
Keyboard control
Keyboard literal button
Keyboard button, pressed
Keyboard label button

Selection frame 1

Selection frame 2
Loupe

Message box 1
Message box 2
Progress view
Progress view

Progress view

Player control
Label button
Back button
Forward button
Option button
Checkbox

Radio button

Alert
Two-button alert
Two-button alert (v 3.0)
-iphone-interface---vector-stencils-library.png--diagram-flowchart-example.png)
Up-Down control

Segmented control
Segmented control
Segmented control
Segmented control
Pop-up menu button

Popup menu

Clock, white
Clock, black

Clock application table

Date and time picker (1/2 parts)
-iphone-interface---vector-stencils-library.png--diagram-flowchart-example.png)
Date and time picker (3 parts)
-iphone-interface---vector-stencils-library.png--diagram-flowchart-example.png)
Date and time picker (4 parts)
-iphone-interface---vector-stencils-library.png--diagram-flowchart-example.png)
Date and time picker (v 3.0)
-iphone-interface---vector-stencils-library.png--diagram-flowchart-example.png)
Switch control
System button

Reply button

Organize button

Remove button

Refresh button

Play button

FastForward button

Pause button

Rewind button

Backward icon
Forward icon
Share button

Camera button

Compose button

Bookmarks button

Search button

Add button

Trash button

Bookmarks tab icon
Contacts tab icon
Downloads tab icon
Favorites tab icon
Featured tab icon
History tab icon
MostRecent tab icon
MostViewed tab icon
Search tab icon
More tab icon
SMS tab icon
Mail tab icon
Charts tab icon
World clock tab icon
Alarm tab icon
Stopwatch tab icon
Timer tab icon
Badge
Delete button control

Checkmark

Delete button

Insert

Disclosure indicator

Clear button

Bookmarks badge
Badge with varying width 1
Badge with varying width 2
Badge with varying width 3
Activity indicator

Network activity indicator

Page control

Search badge
Slider
- Line Gauge Chart
- Slider Charts
- Performance Indicators | Design elements - Sales dashboard | Sales ...
- Slider Sales Dashboard
- Sales dashboard - Vector stencils library | Sales dashboard - Vector ...
- Meter Dashboard | Sales dashboard - Vector stencils library | Sales ...
- Sales dashboard - Vector stencils library | Pie Chart | Pie Chart Word ...
- Sales Growth. Bar Graphs Example
- Meter indicators 2 - Vector stencils library | Sales dashboard - Vector ...
- Sales metrics and KPIs - Visual dashboard | Sales dashboard ...
- Loading Bar Gif
- Gauges Chart
- Performance Indicators | Design elements - Comparison charts and ...
- Vertical Slider Dashboard
- Sales dashboard - Vector stencils library
- Sales dashboard - Vector stencils library
- Design elements - Android switches and sliders | Meter indicators 2 ...
- Sales dashboard - Vector stencils library
- Sales dashboard - Vector stencils library
- Sales dashboard - Vector stencils library