HelpDesk
How to Resize Objects Disproportionately in ConceptDraw PRO

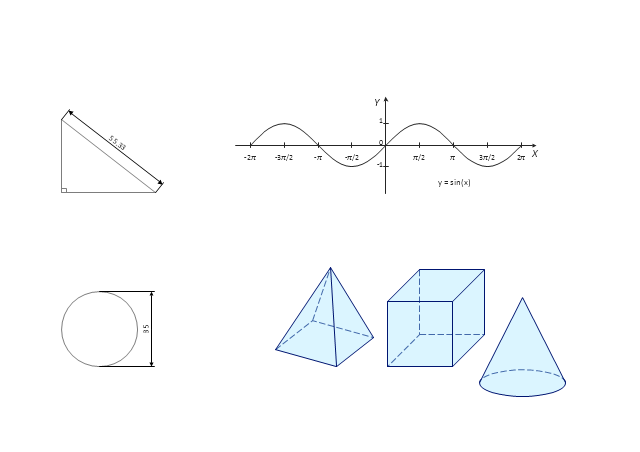
Use this mathematical drawings and graphs template to create your own math illustrations using the shapes of plane and solid geometric figures as well as trigonometric functions.
"Mathematical visualization or mathematical visualization is an aspect of geometry which allows one to understand and explore mathematical phenomena via visualization. Classically this consisted of two-dimensional drawings or building three-dimensional models (particularly plaster models in the 19th and early 20th century), while today it most frequently consists of using computers to make static two or three dimensional drawings, animations, or interactive programs. Writing programs to visualize mathematics is an aspect of computational geometry." [Mathematical visualization. Wikipedia]
The math illustrations template for the ConceptDraw PRO diagramming and vector drawing software is included in the Mathematics solution from the Science and Education area of ConceptDraw Solution Park.
Mathematical drawings and graphs
 Spatial Infographics
Spatial infographics solution extends ConceptDraw PRO software with infographic samples, map templates and vector stencils libraries with design elements for drawing spatial information graphics.
HelpDesk
How to Draw a Mind Map on PC Using ConceptDraw MINDMAP


This cycle diagram sample was created on the base of the figure illustrating the article "Environmental Materials" by Cris Arnold from the website of the UK Centre for Materials Education of the Higher Education Academy. "The figure ... schematically shows how the disparate areas under the heading of 'environmental materials' can be linked via a life cycle analysis approach. ...
Life Cycle Analysis.
Life Cycle Analysis is essentially a method of considering the entire environmental impact, energy and resource usage of a material or product. It is often known as a 'cradle-to-grave' analysis and can encompass the entire lifetime from extraction to end-of-life disposal. Life cycle analysis can be an extremely effective way of linking many different aspects of the environmental impacts of materials usage. ...
Materials Extraction and Resource Implications.
The environmental impact of raw materials extraction and processing together with global resource issues provides a good place to start consideration of environmental aspects of materials. ...
Environmental Impacts of Processing.
... Topics that would come under this subject area include the specific environmental problems associated with processing of metals, polymers, ceramics, composites etc, and how these problems can be overcome.
Design for Sustainability.
This area ... will ... cover issues such as design for successful recycling, waste minimisation, energy efficiency and increased lifetime.
Economic, Social and Legislative Issues.
... For example, materials selection within the automotive industry is now heavily influenced by 'end-of-life vehicle' and 'hazardous material' regulations.
Use of Sustainable Materials.
... It is probably sensible to define such materials as those that have distinct differences that achieve environmental benefit compared to conventional materials. With this definition, the list would include:
(1) Materials of a significantly plant-based nature, including wood, natural fibre composites, natural polymers.
(2) Materials produced using a large proportion of waste material, including recycled polymers, composites made from waste mineral powders, and arguably also much steel and aluminium.
Materials for Green Energy.
The most exciting developments in Materials Science are in the realm of functional materials, and many of these serve an environmentally-beneficial purpose, particularly in the production of green energy.
These include:
(1) Solar-cell materials.
(2) Fuel-cell technology.
(3) Catalytic pollution control.
End-of-Life Issues.
The treatment of materials at the end of their lifetime is a significant subject area and encompasses aspects such as recycling techniques and materials limitations, biodegradabilty and composting, chemical recovery and energy recovery." [materials.ac.uk/ guides/ environmental.asp]
The ring chart example "Life cycle analysis" was created using the ConceptDraw PRO diagramming and vector drawing software extended with the Target and Circular Diagrams solution from the Marketing area of ConceptDraw Solution Park.
www.conceptdraw.com/ solution-park/ marketing-target-and-circular-diagrams
Ring chart

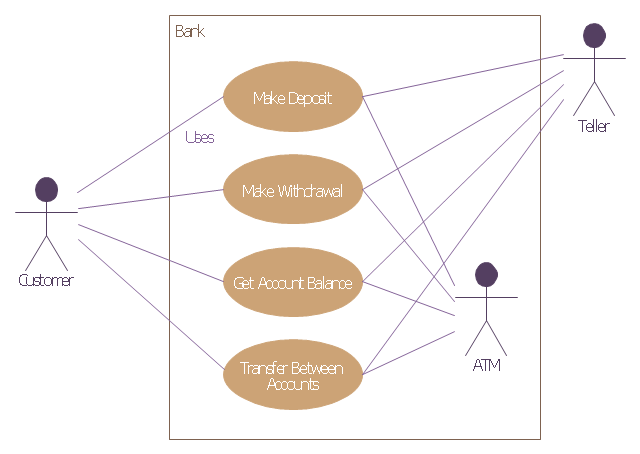
This example of bank ATM UML activity diagram was created on the base of UML use case diagram of automated teller machine from the course "Thinking in Java, 2nd edition, Revision 9" by Bruce Eckel published on the website of the Computer Science and Electrical Engineering Department of the University of Maryland, Baltimore (UMBC).
"If you are designing an auto-teller, for example, the use case for a particular aspect of the functionality of the system is able to describe what the auto-teller does in every possible situation. Each of these “situations” is referred to as a scenario, and a use case can be considered a collection of scenarios. You can think of a scenario as a question that starts with: “What does the system do if...?” For example, “What does the auto-teller do if a customer has just deposited a check within the last 24 hours, and there’s not enough in the account without the check having cleared to provide a desired withdrawal?”
Use case diagrams are intentionally simple to prevent you from getting bogged down in system implementation details prematurely...
Each stick person represents an “actor,” which is typically a human or some other kind of free agent. (These can even be other computer systems, as is the case with “ATM.”) The box represents the boundary of your system. The ellipses represent the use cases, which are descriptions of valuable work that can be performed with the system. The lines between the actors and the use cases represent the interactions.
It doesn’t matter how the system is actually implemented, as long as it looks like this to the user."
[csee.umbc.edu/ courses/ 331/ resources/ tij/ text/ TIJ213.gif]
This automated teller machine (ATM) UML use case diagram example was created using the ConceptDraw PRO diagramming and vector drawing software extended with the ATM UML Diagrams solution from the Software Development area of ConceptDraw Solution Park.
Bank ATM UML sequence diagram
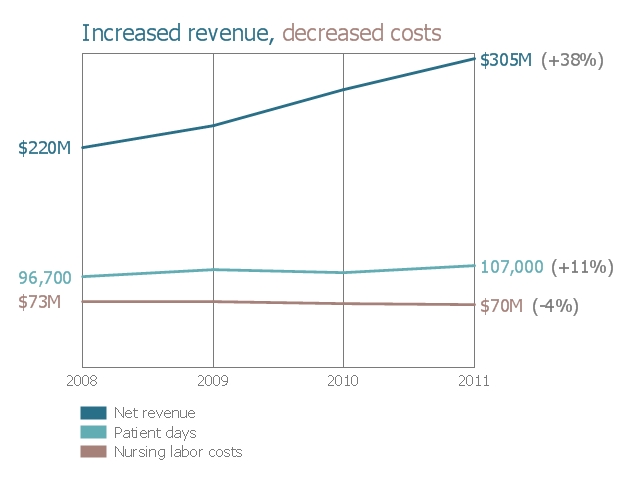
This example was drawn on the base of chart from the webpage "Run your nursing department like a business" on the website of the University of Utah Health Care. "With centralized, global staffing and smaller, flexible nursing pods on each unit, University of Utah Health Care has a healthier financial outlook than ever before, taking care of 11% more patients with 4% less labor—a reduction in nursing labor costs of $100 per patient day."
[healthcare.utah.edu/ nursinginnovation/ 2011/ 10ideas/ one.php]
"A run chart, also known as a run-sequence plot is a graph that displays observed data in a time sequence. Often, the data displayed represent some aspect of the output or performance of a manufacturing or other business process." [Run chart. Wikipedia]
The run chart is one of the Seven Basic Tools of Quality. [Seven Basic Tools of Quality. Wikipedia]
The run chart example "Nursing department finance" was created using the ConceptDraw PRO software extended with the Seven Basic Tools of Quality solution from the Quality area of ConceptDraw Solution Park.
Run chart example
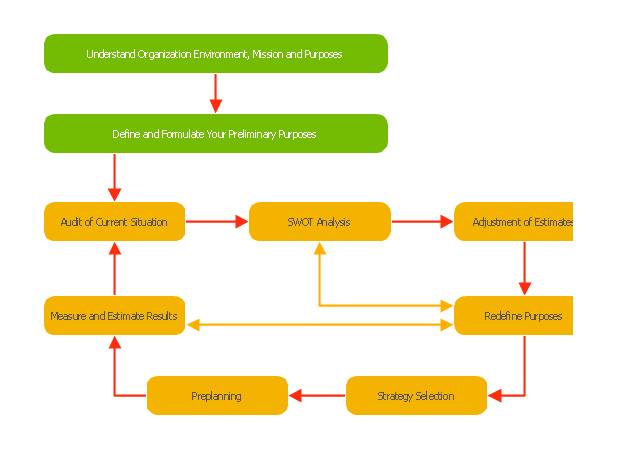
"Planning (also called forethought) is the process of thinking about and organizing the activities required to achieve a desired goal.
Planning involves the creation and maintenance of a plan. As such, planning is a fundamental property of intelligent behavior. This thought process is essential to the creation and refinement of a plan, or integration of it with other plans; that is, it combines forecasting of developments with the preparation of scenarios of how to react to them.
An important, albeit often ignored aspect of planning, is the relationship it holds with forecasting. Forecasting can be described as predicting what the future will look like, whereas planning predicts what the future should look like. The counterpart to planning is spontaneous order." [Planning. Wikipedia]
The block diagram example "Planning process" was created using the ConceptDraw PRO diagramming and vector drawing software extended with the Block Diagrams solution from the area "What is a Diagram" of ConceptDraw Solution Park.
Block diagram
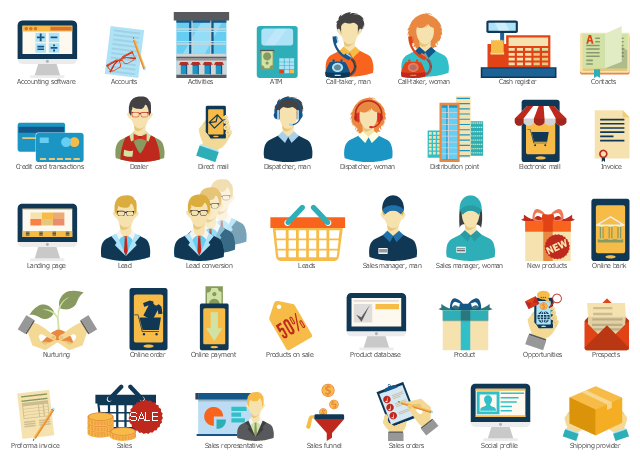
The vector stencils library "Sales workflow" contains 39 workflow symbols.
Use it to design your sales flowcharts, workflow diagrams and process charts by the ConceptDraw PRO diagramming and vector drawing software.
"A workflow is a depiction of a sequence of operations, declared as work of a person, of a simple or complex mechanism, of a group of persons, of an organization of staff, or of machines. Workflow may be seen as any abstraction of real work, segregated into workshare, work split or other types of ordering. For control purposes, workflow may be a view of real work under a chosen aspect." [Business process modeling. Wikipedia]
The symbols example "Design elements - Sales workflow" is included in the Sales Flowcharts solution from the Marketing area of ConceptDraw Solution Park.
Sales workflow symbols
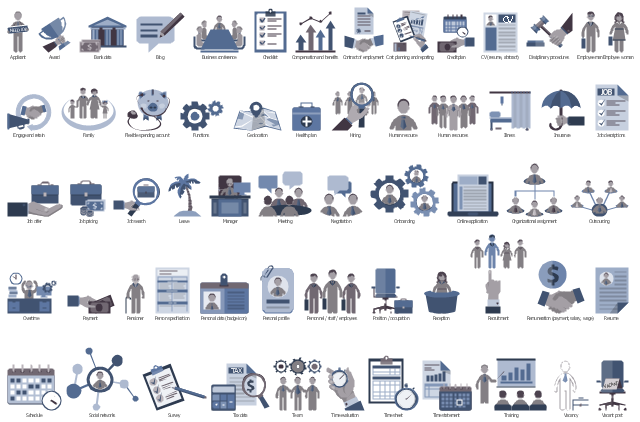
The vector stencils library "HR workflow" contains 60 workflow symbols.
Use it to design your HR flowcharts, workflow diagrams and process charts by the ConceptDraw PRO diagramming and vector drawing software.
"A workflow is a depiction of a sequence of operations, declared as work of a person, of a simple or complex mechanism, of a group of persons, of an organization of staff, or of machines. Workflow may be seen as any abstraction of real work, segregated into workshare, work split or other types of ordering. For control purposes, workflow may be a view of real work under a chosen aspect." [Business process modeling. Wikipedia]
The symbols example "Design elements - HR workflow" is included in the HR Flowcharts solution from the Management area of ConceptDraw Solution Park.
HR workflow symbols
- Flow Chart Of Different Aspect Of Industrial Management
- Block diagram - Types of individual behavior in organization | Basic ...
- Basic Flowchart Symbols and Meaning | Programme Evaluation And ...
- Design elements - Run chart | Nursing department finance | Nursing ...
- Pyramid Diagram and Pyramid Chart | Math illustrations - Template ...
- Mathematical Diagrams | Mathematics Symbols | Math illustrations ...
- Basic Diagramming | Mathematical Diagrams | Math illustrations ...
- Math illustrations - Template | Mathematical Diagrams | Scientific ...
- Bar Diagram Math | Math illustrations - Template | Basic ...
- UML Use Case Diagram Example. Services UML Diagram. ATM ...
- Cross-Functional Flowchart (Swim Lanes) | Swim Lane Diagrams ...
- Sample Of Kpi Template
- KPIs and Metrics | KPI Dashboard | Customer Relationship ...
- UML Tool & UML Diagram Examples | UML Sequence Diagram ...
- Process Flowchart | Engineering | TQM Software — Build ...
- Entertainment - Vector stencils library | Design elements ...
- Building Drawing Software for Design Seating Plan | Seating Plans ...
- Customer Relationship Management | Sale dashboard | Invoice ...
- Basic Flowchart Symbols and Meaning | Workflow Diagram Symbols ...
- How to Design a Good Workflow | Design elements - Workflow ...