This example of cloud computing system architecture diagram was redesigned from the Wikimedia Commons file: ArchitectureCloudLinksSameSite.png. [commons.wikimedia.org/ wiki/ File:ArchitectureCloudLinksSameSite.png]
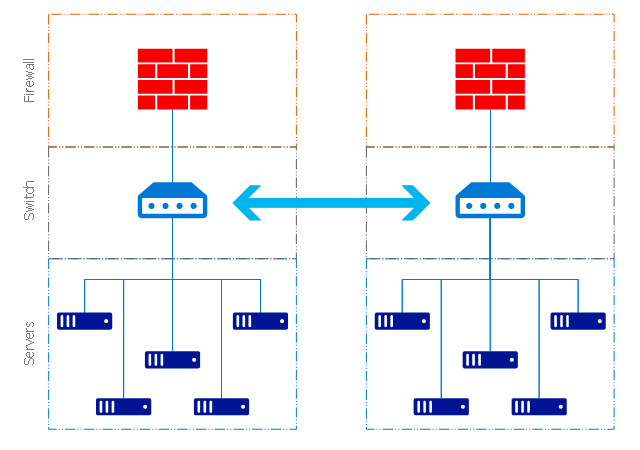
"An example showing a grid computing system connecting many personal computers over the Internet using inter-process network communication ...
In computer science, inter-process communication (IPC) is the activity of sharing data across multiple and commonly specialized processes using communication protocols. Typically, applications using IPC are categorized as clients and servers, where the client requests data and the server responds to client requests." [en.wikipedia.org/ wiki/ Inter-process_ communication]
"Grid computing is the collection of computer resources from multiple locations to reach a common goal. The grid can be thought of as a distributed system with non-interactive workloads that involve a large number of files. Grid computing is distinguished from conventional high performance computing systems such as cluster computing in that grid computers have each node set to perform a different task/ application. Grid computers also tend to be more heterogeneous and geographically dispersed (thus not physically coupled) than cluster computers." [Grid computing. Wikipedia]
The diagram example "Grid computing system architecture" was created using ConceptDraw PRO diagramming and vector drawing software extended with the Azure Architecture solution from the Computer and Networks area of ConceptDraw Solution Park.
Grid computing system architecture diagram
Basic Flowchart Symbols and Meaning


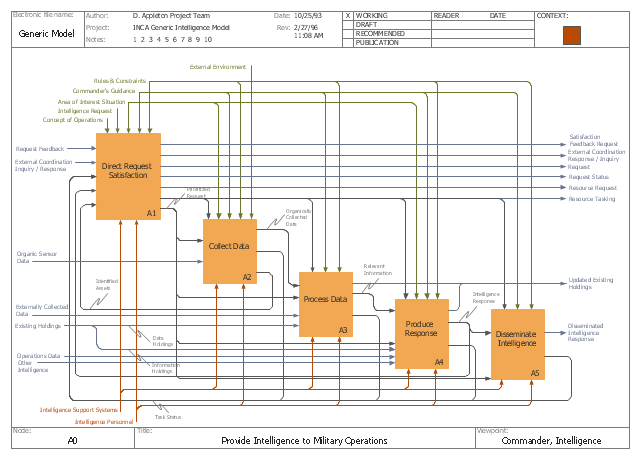
This IDEF0 diagram example was redesigned from the Wikimedia Commons file: C4ISR Architecture Framework, Example Activity Diagram in IDEF0 Format.jpg. [commons.wikimedia.org/ wiki/ File:C4ISR_ Architecture_ Framework,_ Example_ Activity_ Diagram_ in_ IDEF0_ Format.jpg]
"... the C4ISR concept of Command, Control, Communications, Computers, Intelligence, Surveillance and Reconnaissance ..." [en.wikipedia.org/ wiki/ C4ISR]
"The C4ISR Architectural Framework (C4ISR AF) is now known as DoDAF, is a reference model developed by the US Department of Defense in the 1990s." [commons.wikimedia.org/ wiki/ Category:C4ISR_ Architecture_ Framework]
"The Department of Defense Architecture Framework (DoDAF) is an architecture framework for the United States Department of Defense (DoD) that provides visualization infrastructure for specific stakeholders concerns through viewpoints organized by various views. These views are artifacts for visualizing, understanding, and assimilating the broad scope and complexities of an architecture description through tabular, structural, behavioral, ontological, pictorial, temporal, graphical, probabilistic, or alternative conceptual means.
This Architecture Framework is especially suited to large systems with complex integration and interoperability challenges, and it is apparently unique in its employment of "operational views". These views offer overview and details aimed to specific stakeholders within their domain and in interaction with other domains in which the system will operate." [en.wikipedia.org/ wiki/ Department_ of_ Defense_ Architecture_ Framework]
The example "C4ISR architecture framework - IDEF0 activity diagram" was created using the ConceptDraw PRO diagramming and vector drawing software extended with the solution "IDEF Business Process Diagrams" from the area "Business Processes" of ConceptDraw Solution Park.
IDEF0 business process diagram
Used Solutions
 Circular Arrows Diagrams
Circular Arrows Diagrams solution extends ConceptDraw PRO v10 with extensive drawing tools, predesigned samples, Circular flow diagram template for quick start, and a library of ready circular arrow vector stencils for drawing Circular Arrow Diagrams, Segmented Cycle Diagrams, and Circular Flow Diagrams. The elements in this solution help managers, analysts, business advisers, marketing experts, scientists, lecturers, and other knowledge workers in their daily work.
 Azure Architecture
Azure Architecture solution bundles into one handy tool everything you need to create effective Azure Architecture diagrams. It adds the extra value to versatile ConceptDraw PRO software and extends the users capabilities with comprehensive collection of Microsoft Azure themed graphics, logos, preset templates, wide array of predesigned vector symbols that covers the subjects such as Azure management, Azure storage, and Azure services, amongst others, and allow you to illustrate Azure Architecture diagrams at any degree of complexity, to present visually your Azure cloud system architecture with professional style, to design Azure cloud topology, to document Windows Azure Architecture and Azure Cloud System Architecture, to visualize the great abilities and work of Microsoft Azure Cloud System and Azure services.
 Basic Circular Arrows Diagrams
This solution extends ConceptDraw PRO v10 (or later) with samples, templates, and a library of vector stencils for drawing circular arrow diagrams.
This circular arrows diagram example shows the Performance and Architecture Laboratory (PAL) circle. It was designed on the base of the diagram on the article "Advanced Computing, Mathematics and Data Division Research Highlights" webpage from the website of the Pacific Northwest National Laboratory of the U.S. Department of Energy.
"The Performance and Architecture Laboratory, or PAL, at Pacific Northwest National Laboratory (PNNL) takes on power and energy problems affecting high-performance computing (HPC), especially issues that may impact achieving practical performance at the exascale. Using methods that span processor architecture and system integration to software and programming models to performance and power modeling, PAL scientists, who are part of PNNL's HPC Group, have developed power-aware algorithms that use an accurate per-core proxy power sensor model to estimate the active power of each core. Their methods also have afforded the first workload-specific quantitative power modeling capability that accurately captures workload phases, their impact on power consumption, and the effects of system architecture and processor clock speeds." [pnnl.gov/ science/ highlights/ highlight.asp?id=1572]
The arrow circle diagram example "Performance and power modeling" was created using the ConceptDraw PRO diagramming and vector drawing software extended with the Circular Arrows Diagrams solution from the area "What is a Diagram" of ConceptDraw Solution Park.
Arrow circle diagram
AWS Simple Icons for Architecture Diagrams

ConceptDraw Arrows10 Technology

 IDEF Business Process Diagrams
Use the IDEF Business Process Diagrams solution to create effective database designs and object-oriented designs, following the integration definition methodology.