This example was designed on the base of Wikimedia Commons file: Example ERD2.png.
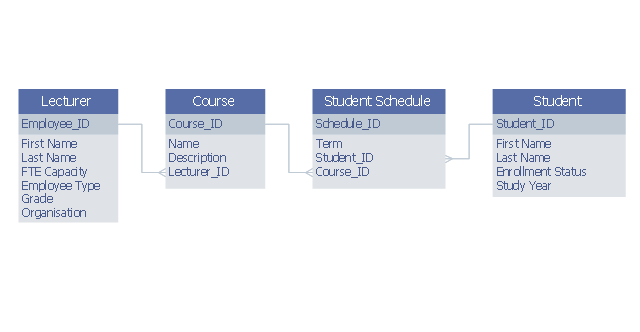
"example entity relationship diagram showing relationship between lecturers and students" [commons.wikimedia.org/ wiki/ File:Example_ ERD2.png]
This file is licensed under the Creative Commons Attribution-Share Alike 3.0 Unported license. [creativecommons.org/ licenses/ by-sa/ 3.0/ deed.en]
"Relationship diagrams (also known as logical data models) are used to design relational databases and can be a good way of understanding the structures in a data set. The 3 building blocks of an Entity Relationship model are entities, attributes and relationships. An entity is a discrete and recognisable 'thing', either a pysical object ..., or concept ... Each entity can be physically represented as a table, where each column of the table is an attribute of the entity ... A relationship is a verb that links two or more entities. ... Importantly, relationships also have a cardinality that can be 'one to one', 'many to one', 'one to many' or 'many to many'. ... Many to many relationships are often a sign that a design needs to be further elaborated. For example the 'teaches' relationship between teachers and students at a university would be many to many and would require the introduction of entities like class and date to fully understand the relationship." [en.wikibooks.org/ wiki/ Data_ Science:_ An_ Introduction/ Thinking_ Like_ a_ Data_ Engineer]
The entity-relationship diagram example "Lecturers-students relationship ERD" was drawn using ConceptDraw PRO software extended with the Entity-Relationship Diagram (ERD) solution from the Software Development area of ConceptDraw Solution Park.
Entity-relationship diagram
 Entity-Relationship Diagram (ERD)
An Entity-Relationship Diagram (ERD) is a visual presentation of entities and relationships. That type of diagrams is often used in the semi-structured or unstructured data in databases and information systems. At first glance ERD is similar to a flowch
ConceptDraw DIAGRAM ER Diagram Tool

How to Draw ER Diagrams

 Education Package
Education Package is a comprehensive set of multifarious graphical solutions from ConceptDraw Solution Park, collected together in help to ConceptDraw DIAGRAM users working in a field of science, education and training, which is aimed at improving the quality of education and helping to design with ease variety of interesting and colorful educational materials, diagrams, charts and maps. Use it to present the information and knowledge in an interesting, clear, structured and simple form to achieve a success in education and pedagogy, to maintain the interest of students and pupils throughout the whole learning process, at the lectures, lessons and even during independent work with additional materials, to contribute to better perception of scientific information by listeners during the conferences and reports.
Data Flow Diagram Symbols. DFD Library

 School and Training Plans
School and Training Plans solution enhances ConceptDraw DIAGRAM functionality with extensive drawing tools, numerous samples and examples, templates and libraries of classroom design elements for quick and professional drawing the School and Training plans, School Floor plans, Classroom Layout, Classroom Seating chart, Lecture Room plans of any complexity. Each offered classroom seating chart template is a real help for builders, designers, engineers, constructors, as well as teaching personnel and other teaching-related people in drawing Classroom Seating charts and Training Room layouts with ConceptDraw DIAGRAM classroom seating chart maker.
Health Package
Health Package is a set of multifaceted solutions intended for visualization and illustration in a field of medicine and health, for drawing colorful, interesting and precise illustrations and infographics that will be used successfully in medical documents, articles, special magazines, posters, billboards, websites, presentations, collages. Having these solutions available, it will not be difficult to illustrate the medical editions, to convey the information in a full and interesting form, to teach students with use effective visual methods, to describe the medical facts, to tell about innovations in a field of medicine, health and correct nutrition, to explain the causes and consequences of different diseases, as well as the measures of their prevention and treatment.
Applications

 Medical Illustrations
Medical Illustrations solution including the set of professionally developed examples and samples dedicated to medicine, large variety of ready-to-use vector objects and icons of diagnostic equipment, treatment equipment, medical instruments, tools and devices, medical professionals and health workers of different medical specialties, medical procedures and patients, medical pictograms and medical symbols, among which are the famous red cross symbol, heartbeat symbol, doctor symbol, and many others, is a perfect help in questions of medical illustration and medical imaging, creation professional-looking, colorful and attractive Medical illustrations, Medical diagrams and infographics, slides for presentations in a field of medicine and health care, depicting the medical facts, the information about varied diseases and ways of medical diagnosis, methods of prevention and treatment diseases.
- Draw Er Diagram Between Lecturer And Student
- Dataflow Diagram Of A Student Lecturer Relationship
- Teacher And Student Schedule Erd
- Er Diagram On Class Room Class Student Teacher
- Er Diagram Of Student And Teacher
- Lecturers - students relationship ERD
- Teacher And Student Relationship Clipart
- Er Diagram For Student Database
- Teacher Student Er Diagram Examples
- Conceptdraw Student