UML Activity Diagram

"An automated teller machine or automatic teller machine" (ATM) (American, Australian, Singaporean, Indian, and Hiberno-English), also known as an automated banking machine (ABM) (Canadian English), cash machine, cashpoint, cashline or hole in the wall (British, South African, and Sri Lankan English), is an electronic telecommunications device that enables the clients of a financial institution to perform financial transactions without the need for a cashier, human clerk or bank teller.
On most modern ATMs, the customer is identified by inserting a plastic ATM card with a magnetic stripe or a plastic smart card with a chip that contains a unique card number and some security information such as an expiration date or CVVC (CVV). Authentication is provided by the customer entering a personal identification number (PIN). The newest ATM at Royal Bank of Scotland allows customers to withdraw cash up to £100 without a card by inputting a six-digit code requested through their smartphones.
Using an ATM, customers can access their bank accounts in order to make cash withdrawals, get debit card cash advances, and check their account balances as well as purchase pre-paid mobile phone credit. If the currency being withdrawn from the ATM is different from that which the bank account is denominated in (e.g.: Withdrawing Japanese yen from a bank account containing US dollars), the money will be converted at an official wholesale exchange rate. Thus, ATMs often provide one of the best possible official exchange rates for foreign travellers, and are also widely used for this purpose." [Automated teller machine. Wikipedia]
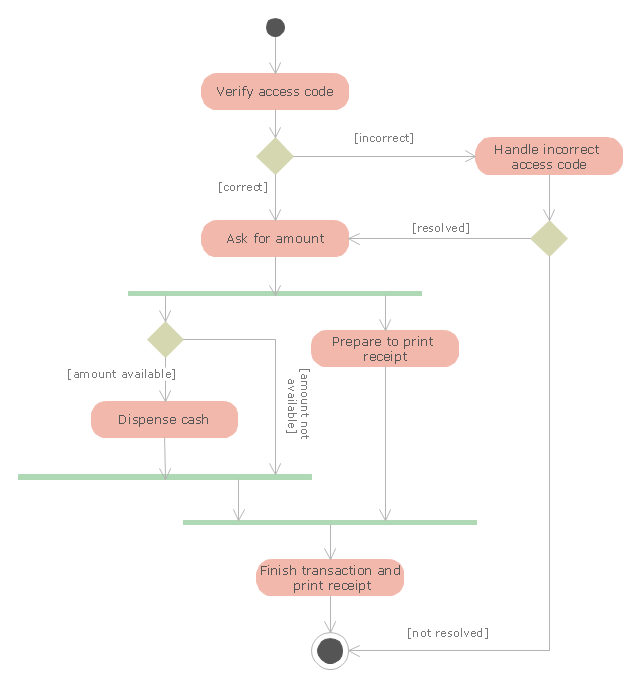
The UML activity diagram example "Cash withdrawal from ATM" was created using the ConceptDraw PRO diagramming and vector drawing software extended with the Rapid UML solution from the Software Development area of ConceptDraw Solution Park.
On most modern ATMs, the customer is identified by inserting a plastic ATM card with a magnetic stripe or a plastic smart card with a chip that contains a unique card number and some security information such as an expiration date or CVVC (CVV). Authentication is provided by the customer entering a personal identification number (PIN). The newest ATM at Royal Bank of Scotland allows customers to withdraw cash up to £100 without a card by inputting a six-digit code requested through their smartphones.
Using an ATM, customers can access their bank accounts in order to make cash withdrawals, get debit card cash advances, and check their account balances as well as purchase pre-paid mobile phone credit. If the currency being withdrawn from the ATM is different from that which the bank account is denominated in (e.g.: Withdrawing Japanese yen from a bank account containing US dollars), the money will be converted at an official wholesale exchange rate. Thus, ATMs often provide one of the best possible official exchange rates for foreign travellers, and are also widely used for this purpose." [Automated teller machine. Wikipedia]
The UML activity diagram example "Cash withdrawal from ATM" was created using the ConceptDraw PRO diagramming and vector drawing software extended with the Rapid UML solution from the Software Development area of ConceptDraw Solution Park.
UML activity diagram
 Event-driven Process Chain Diagrams
Event-driven Process Chain (EPC) Diagram is a type of flowchart widely used for modeling in business engineering and reengineering, business process improvement, and analysis. EPC method was developed within the Architecture of Integrated Information Systems (ARIS) framework.
 Data Flow Diagrams (DFD)
Data Flow Diagrams solution extends ConceptDraw PRO software with templates, samples and libraries of vector stencils for drawing the data flow diagrams (DFD).
UML Deployment Diagram Example - ATM System UML diagrams

 Business Process Diagrams
Business Process Diagrams solution extends the ConceptDraw PRO BPM software with RapidDraw interface, templates, samples and numerous libraries based on the BPMN 1.2 and BPMN 2.0 standards, which give you the possibility to visualize equally easy simple and complex processes, to design business models, to quickly develop and document in details any business processes on the stages of project’s planning and implementation.
 IDEF0 Diagrams
IDEF0 Diagrams visualize system models using the Integration Definition for Function Modeling (IDEF) methodology. Use them for analysis, development and integration of information and software systems, and business process modelling.
 Scatter Diagrams
The Scatter Diagrams solution extends ConceptDraw PRO v10 functionality with templates, samples, and a library of vector stencils that make construction of a Scatter Plot easy. The Scatter Chart Solution makes it easy to design attractive Scatter Diagrams used in various fields of science, work, and life activities. ConceptDraw PRO lets you enter the data to the table and construct the Scatter Plot Graph automatically according to these data.
 Entity-Relationship Diagram (ERD)
Entity-Relationship Diagram (ERD) solution extends ConceptDraw PRO software with templates, samples and libraries of vector stencils from drawing the ER-diagrams by Chen's and crow’s foot notations.
Diagramming Software for Design UML Activity Diagrams
")

 Cross-Functional Flowcharts
Cross-functional flowcharts are powerful and useful tool for visualizing and analyzing complex business processes which requires involvement of multiple people, teams or even departments. They let clearly represent a sequence of the process steps, the order of operations, relationships between processes and responsible functional units (such as departments or positions).
UML Use Case Diagram Example. Services UML Diagram. ATM system

 Entity-Relationship Diagram (ERD)
An Entity-Relationship Diagram (ERD) is a visual presentation of entities and relationships. That type of diagrams is often used in the semi-structured or unstructured data in databases and information systems. At first glance ERD is similar to a flowch
 Fishbone Diagram
Fishbone Diagrams solution extends ConceptDraw PRO software with templates, samples and library of vector stencils for drawing the Ishikawa diagrams for cause and effect analysis.
- UML activity diagram - Cash withdrawal from ATM | UML Activity ...
- UML activity diagram - Cash withdrawal from ATM | Design elements ...
- ATM UML Diagrams
- Activity Diagram For Atm In Uml
- UML activity diagram - Cash withdrawal from ATM | UML Use Case ...
- UML Deployment Diagram Example - ATM System UML diagrams ...
- UML activity diagram - Cash withdrawal from ATM | ATM UML ...
- UML activity diagram - Cash withdrawal from ATM | UML ...
- Activity Diagram From Atm System
- UML activity diagram - Cash withdrawal from ATM | UML Tool ...
- UML Deployment Diagram Example - ATM System UML diagrams ...
- UML Deployment Diagram Example - ATM System UML diagrams ...
- UML activity diagram - Cash withdrawal from ATM | Hole In The Wall
- UML activity diagram - Cash withdrawal from ATM | Bank ATM use ...
- Bank Sequence Diagram | UML Deployment Diagram Example ...
- UML activity diagram - Cash withdrawal from ATM | How to Create a ...
- Use Case Diagram For Atm Machine For Withdrawing Cash
- UML activity diagram - Cash withdrawal from ATM | UML Business ...
- Activity Diagram For Atm System
- ATM UML Diagrams | UML activity diagram - Cash withdrawal from ...