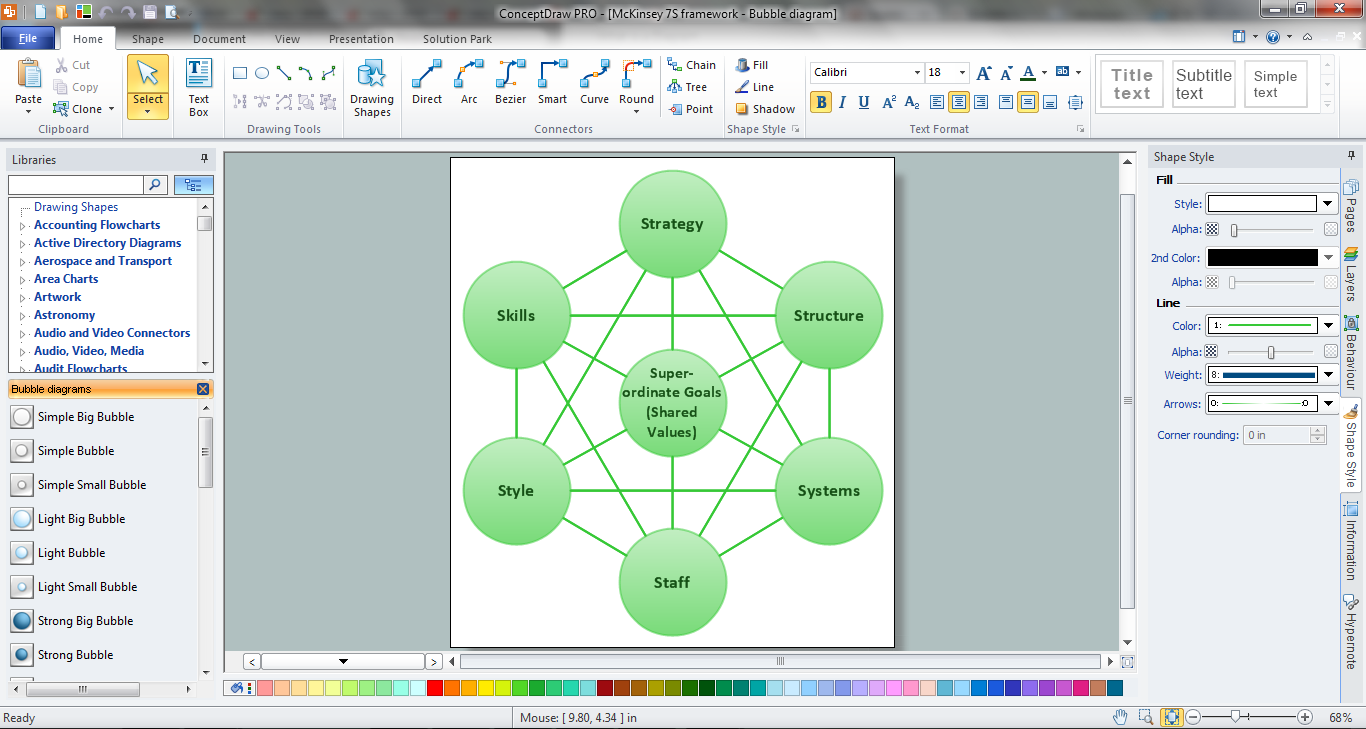
Bubble Charts
Bubble Charts are convenient way to visualize ideas and concepts by organizing them in a hierarchy. To show the importance of ideas you can use different bubble sizes and colors. ConceptDraw PRO diagramming and vector drawing software extended with Bubble Diagrams Solution from the "What is a Diagram" Area affords you the easiest and fastest way for designing professional looking Bubble Charts.
 Bubble Diagrams
Bubble diagrams have enjoyed great success in software engineering, architecture, economics, medicine, landscape design, scientific and educational process, for ideas organization during brainstorming, for making business illustrations, presentations, planning, design, and strategy development. They are popular because of their simplicity and their powerful visual communication attributes.
Bubble Map Maker
The Bubble Map is a popular tool for visualization a data set which is widely used in economics, medicine, software engineering, architecture, and many other fields. Each bubble on the Bubble Map is characterized by coordinates, color and size. ConceptDraw PRO diagramming and vector drawing software extended with Bubble Diagrams Solution from the "What is a Diagram" Area is a powerful Bubble Map Maker.- McKinsey 7S framework | Bubble Charts | Bubble Diagrams | 7s ...
- McKinsey 7S framework | Bubble Diagrams | Bubble Charts ...
- McKinsey 7S framework - Bubble diagram | Bubble Charts | Bubble ...
- McKinsey 7S framework | Mckinsey 7s Wiki
- McKinsey 7S framework | 7 Continents Map | Bubble Charts | 7s
- Bubble Chart | Event-driven Process Chain Diagrams | Venn ...
- Sketch A Diagram Of Mckinseys 7s Framework
- Replacing engine oil - Opportunity flowchart | Activity Network ...
- Global cumulative energy-related CO2 emissions | Venn Diagram ...
- Bubble diagrams in Landscape Design with ConceptDraw PRO ...
- 7s Office Chart
- Professions - Vector stencils library | Professions - Vector stencils ...
- McKinsey 7S framework
- PageRank | Bubble Chart Maker | Bubble Diagrams | Pagerank
- Bubble Diagrams | How to Add a Bubble Diagram to a PowerPoint ...
- Management pictograms - Vector stencils library | Must Have ...
- How To Make a Bubble Chart | Bubble Chart Maker | Bubble ...
- PageRank | Bubble Diagrams | Bubble Chart | Page Rank
- Building Drawing Software for Design Site Plan | Building Drawing ...
- Database Design | How To Create a Bubble Chart | Bubble ...

