Venn Diagrams
Venn Diagrams are the intuitive way to work with sets which allows to visualize all possible logical relations between several sets. They are popular and widely used in:
- mathematics,
- marketing,
- logic,
- statistics,
- sociology, etc.
ConceptDraw DIAGRAM software extended with Business Diagrams solution from the Management area offers set of useful drawing tools for easy creating the Venn Diagrams for any quantity of sets.
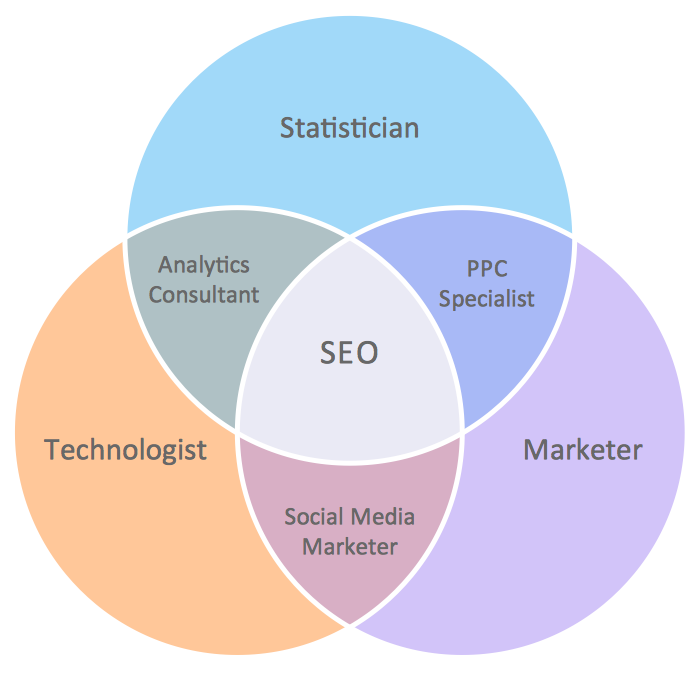
Example 1. Venn Diagrams — Internet Marketing Professions
Business Diagrams Solution offers powerful drawing tools, a set of Venn Diagram examples and templates, and also the Venn Diagrams library with numerous ready-to-use vector objects. It's convenient that you don't need to focus on the design of individual elements, you can use the ready objects from the library.

Example 2. Venn Diagrams Library Design Elements
The use of predesigned shapes from the Business Diagrams solution allows anyone design its own Venn Diagram without efforts. All these shapes are bright and colorful, so they let us the possibility to design successful Venn Diagrams and use them in presentations, reportages, reports, various reviews, etc.

Example 3. Venn Diagrams — Sustainable Development
The samples you see on this page were created in ConceptDraw DIAGRAM using the vector objects from the Venn Diagrams library from the Business Diagrams Solution. These samples demonstrate solution's capabilities and professional results you can achieve. An experienced user spent 5 minutes creating every of these samples.
Use the tools of Business Diagrams solution to effectively design your own Venn Diagrams and then successfully use them.
All source documents are vector graphic documents. They are available for reviewing, modifying, or converting to a variety of formats (PDF file, MS PowerPoint, MS Visio, and many other graphic formats) from the ConceptDraw STORE. The Venn Diagrams Solution is available for ConceptDraw DIAGRAM users.
FIVE RELATED HOW TO's:
Working as a designer, you might find developing projects exciting and difficult at the same time. It is a challenging task to create a usable interior design that will fulfill all the customer’s requirements. So, in order to aid yourself, you can use special software to create site plans, landscape designs, furniture layouts.
This example of an interior plan introduces an internal area of a small cafe. The floor plan demonstrates interior angle "view from above". It involves many different elements of furniture such as tables , chairs and various cushioned furniture. Also it includes a kitchen fixtures and furniture. Making this plan was managed by the ConceptDraw Cafe and Restaurant Floor Plan solution. The libraries, composing this solution contain about vector graphic 300 objects. It can be use to help interior designers to develop interior design proposals, communicate ideas and concepts that relate to a interior design.
Picture: Interior Design
Related Solution:
ConceptDraw DIAGRAM diagramming and vector drawing software extended with Mathematics solution from the Science and Education area is the best for creating: mathematical diagrams, graphics, tape diagrams various mathematical illustrations of any complexity quick and easy.
Mathematics solution provides 3 libraries: Plane Geometry Library, Solid Geometry Library, Trigonometric Functions Library.
Picture: Mathematical Diagrams
Related Solution:
Design efficiently the technical flow charts in ConceptDraw DIAGRAM software for various fields and provide ✔️ clarity, ✔️ accuracy, ✔️ usability, ✔️ simple communication, analysis, and improvement
Picture: Technical Flow Chart Example
Related Solution:
Having the already previously created samples of the Venn diagrams can help any ConceptDraw DIAGRAM user make it possible to make the needed drawing within only a few minutes by editing the existing ones.
Picture: Venn Diagram Examples for Problem Solving
Related Solution:
Venn diagrams are illustrations used in the branch of mathematics known as set theory.
Use ConceptDraw DIAGRAM to quick and easy design your own Venn Diagram of any complexity.
Picture: Venn Diagram
Related Solution: