Simple Flow Chart Maker: A Comprehensive Guide
Introduction to Flowcharting
A Flow chart is a simple graphical representation of steps of the workflow or process in sequential order. Usually, the rectangular boxes are used to show the steps of the flow called activities and are connected with arrows illustrating the sequence of actions and how one step leads to another. Diamond shapes are used to show decisions. Rounded rectangles, trapezoids, cylinders, circles, and other shapes are also used to draw the components of the Flow charts.
Flow charts are one of the most common diagram types. It is a popular tool in many technical and non-technical areas to document and explain information, logic, sequence of actions, and reasoning. They help to visualize the structure of a project, system, problem, task, both complex and simple processes, and contribute to planning, communicating, decision-making, and improvement of the processes.
The implementation of any project is easy with a pre-made diagram Flowchart, which provides a step-by-step approach to solving a task. Being used in computer science and software development, Flow charts help to show algorithms and programming logic before starting to code, the structure of a website or application. They are helpful to show how the code is organized and executed, how users navigate a website or program, and other details.

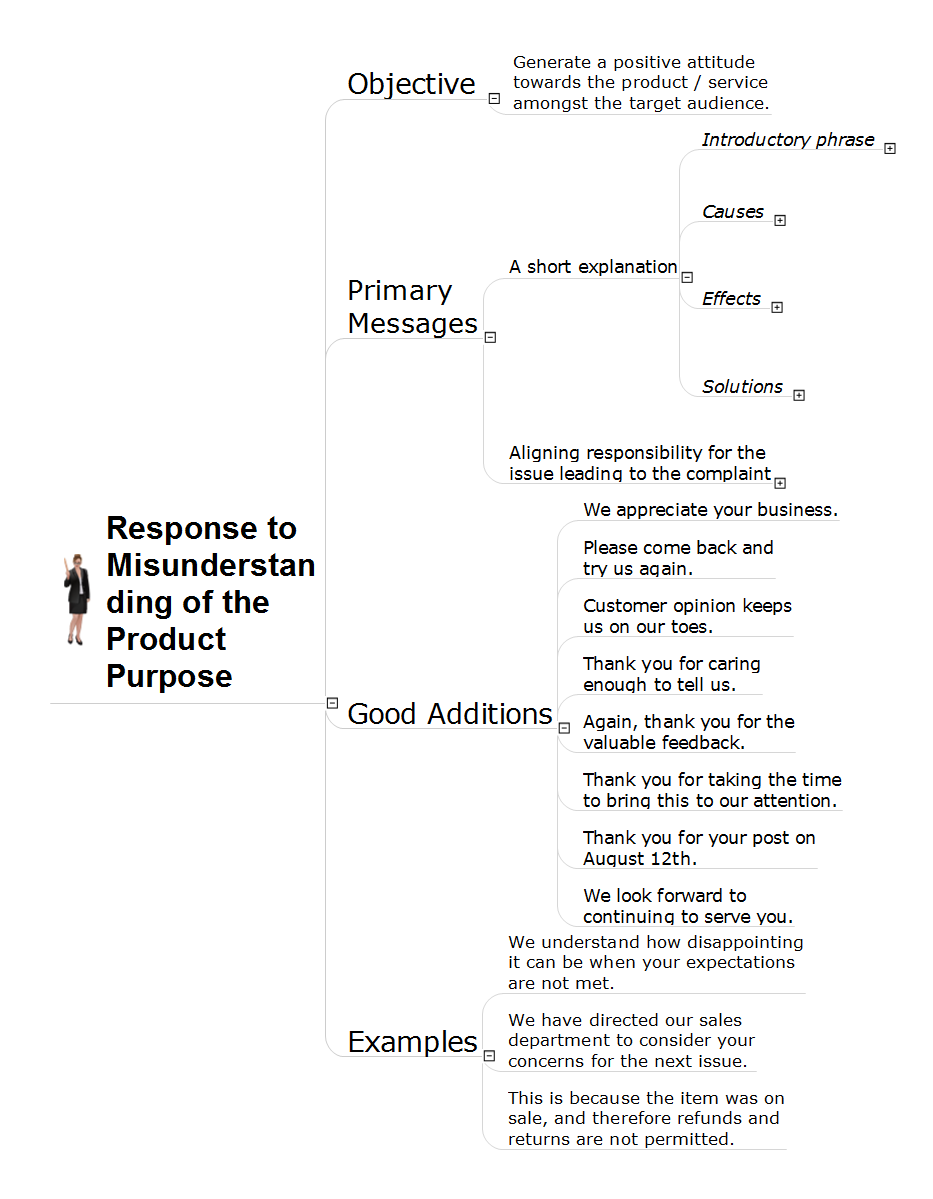
Example 1. Flowchart Design Using Simple Flow Chart Tool
Application of Flow Charts
Flow charts help to organize efficient teamwork and collaboration between team members, plan research strategies in marketing and sales, audit process, chart sales processes and surveys. Flow charts are a beneficial visual form for presentations and reports and are also useful during education and training to plan a lesson, create schematics to outline scientific processes, theories, hypotheses, and hierarchies, plan individual or group academic projects, coursework, outline requirements, etc.
Flow charts help to illustrate the manufacturing and engineering processes from beginning to end, improve its understanding, show process flows and system flows, assess the life cycle of a structure, identify resources, detect and eliminate inefficiencies in a manufacturing and procurement process, avoid breakdowns in communication and additional expenses.
Flow charts perfectly meet the business documentation requirements to document the internal and external business processes, comply with reports, outline regulations, requirements, etc. They are visible to explain tasks and requirements to both new employees and existing ones, flexible to be updated at any changes, help to improve processes and ensure the quality of performed work being one of the seven basic tools of quality control.
Flow charts are used to develop and show a business plan or product realization plan, document and analyze the business processes, break down processes into smaller steps to clarify them and easier identification of inefficiencies and areas to improve. They help to clarify the order, employees' tasks, daily routine, and goals to focus on, highlight specific strategic and tactical objectives, and contribute to easy decision-making, business growth, and enhancement performance.
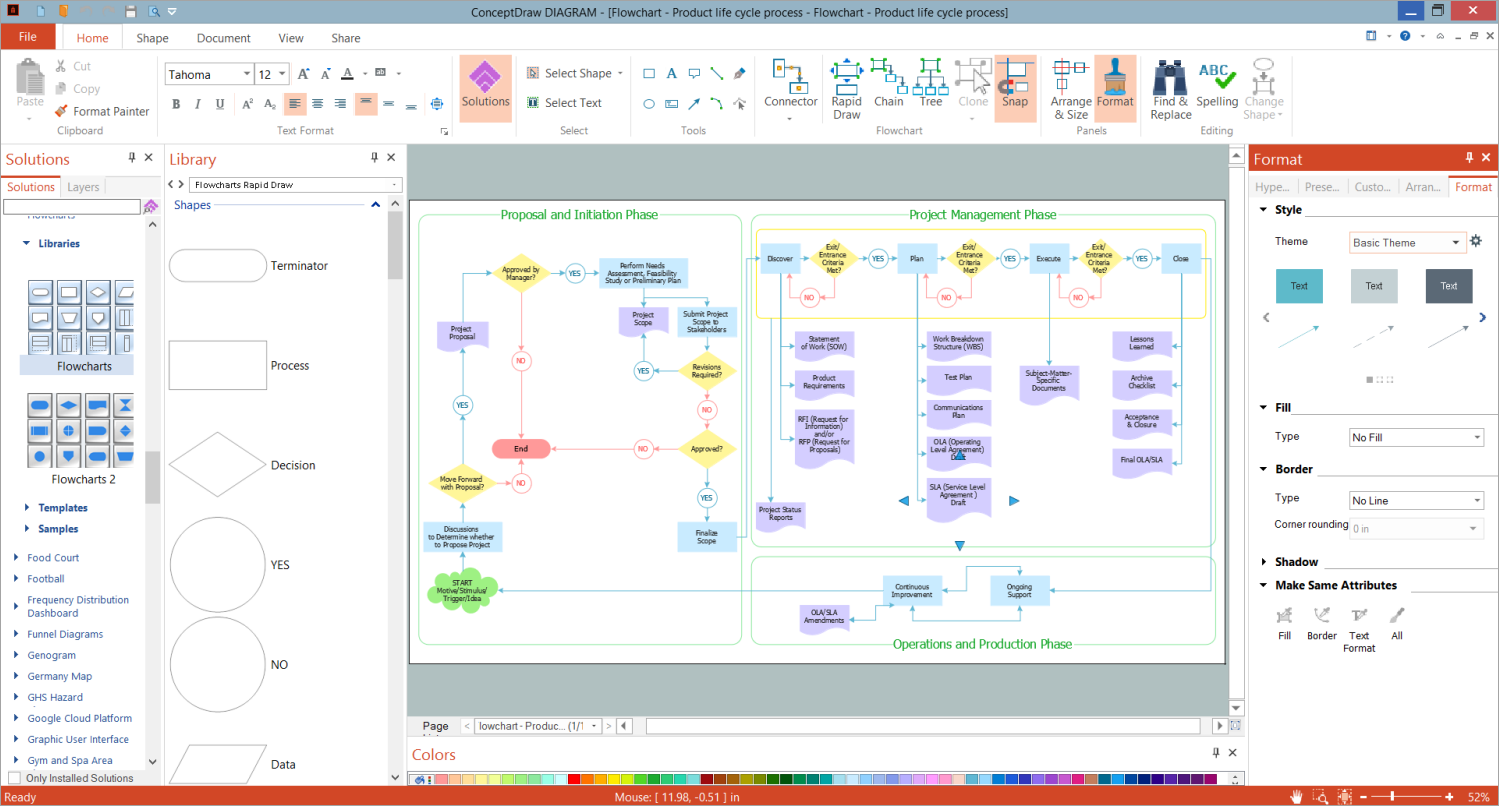
Example 2. Flowchart Making Software — ConceptDraw DIAGRAM Software
Flow Charts Enhance Productivity
The Flow charts enhance productivity, simplify tasks, save time, boost productivity, and allow more efficient decision-making and faster execution. They are helpful in clarifying complex processes, detecting bottlenecks, flaws, redundancies, delays, duplication, unnecessary steps, non-value-adding steps, and other inefficiencies in processes or programs to improve and standardize a process for efficiency, quality, communication, consistency, and collaboration with other departments of the organization. Flow charts make complex tasks easier to understand and follow, help streamline workflows and reduce errors. They assist in the description of the control of different organizational units and the allocation of responsibilities in various parts of a single process efficiently.
ConceptDraw DIAGRAM: Benefits of Using a Simple Flow Chart Maker
Flow charts differ in complexity, from simple charts to multi-stepped and multi-leveled. They are drawn both by hand and using special diagramming software to create flowcharts. However, using a professional easy flowchart maker offers numerous benefits. Primarily, it provides simplicity in creating clear and engaging Flow charts of any complexity, breaking down complex processes into clear and easy-to-understand steps. With professional and easy-to-use tools, you can quickly create and modify your Flow charts at any time.
Flow chart software helps organize thoughts, ideas, and processes systematically. Additionally, it often provides ready-made templates for a quick start, saving your time and increasing your productivity and work efficiency. The clearly designed Flow charts improve planning, decision-making, and problem-solving, project management and strategy development, help identify inefficiencies or errors in a short time, and make their reduction easier. Flow chart makers with sharing features improve the collaboration of teams and facilitate communication.
ConceptDraw DIAGRAM vector drawing and diagramming software greatly helps in designing accurate and comprehensive Flow charts of different kinds: Process Flowcharts, Decision Flowcharts, Functional Flowcharts, Swimlane Flowcharts, Event-driven Flowcharts, and others. Sometimes, Flow charts are complemented with charts of other types to explain additional details and certain aspects of processes more deeply.

Example 3. Flowcharts Solution — Libraries Design Elements
ConceptDraw DIAGRAM extended with Flowcharts solution is a simple Flow chart maker useful for any area. You can design Flow charts of any complexity and use them for both internal and external purposes. Visualize the algorithms, business processes, tasks, and other data, and simplify their understanding by the audience. Streamline the creation and editing of Flowcharts due to solution tools and make a flow diagram drawing process more efficient and collaborative.
Design a new process or identify and understand the steps of an existing one, analyze and effect changes to improve the process. Map out a new project or analyze the existing one. Use the Flow chart to gather information and identify the objectives, risks, and controls in a process, order processing, onboard new employees and explain them visually the responsibilities and requirements. Share your Flowcharts, collaborate with your team efficiently, and make decisions fast and easily. Break complex processes into smaller parts to clarify them better, because clear communication is a key goal of Flow charts. If required, create a multi-page document and break up your processes into separate pages.
Flowchart Examples
Use the Flowcharts solution tool to make Flowchart for fast, simple and effective drawing professional-looking Flowcharts and Flow diagrams. The Flowcharts you see on this page were created in ConceptDraw DIAGRAM flowchart software. They are included in Flowcharts Solution and available for ConceptDraw DIAGRAM users from the ConceptDraw STORE. All source documents are vector graphic documents. They are available for reviewing, modifying, or converting to a variety of formats:
| — MS Visio, |
| — PDF file, |
| — MS PowerPoint |
| — Adobe Flash, |

Example 4. Flowchart — Planning Process
Conclusion
ConceptDraw DIAGRAM extended with Flowcharts solution is the easiest way to make a Flowchart. It is a simple Flowchart maker useful for any area. Use the simple tools of the Flowcharts solution to make the flowchart drawing process more efficient and collaborative. Flowcharts solution helps to design Flow charts of any complexity for both internal and external purposes. Visualize the algorithms, business processes, tasks, and simplify their understanding by the audience. Clarify complex processes, detect bottlenecks, flaws, redundancies, delays, duplication, unnecessary steps, non-value-adding steps, and other inefficiencies in processes or programs. Improve and standardize a process for efficiency, quality, and communication with other departments of the organization.