Made with
ConceptDraw
DIAGRAM 18

Organizational Management

Organizational Management is an integral part of a modern company. It is an area of management activity which is directed on the construction of an organization as a system for the effective development and realization of its designated purpose, for implementation of competitive ideas and profit earning. ConceptDraw DIAGRAM extended with 25 Typical Orgcharts solution from the Management area is perfect software for Organizational Management.

Organizational Management *

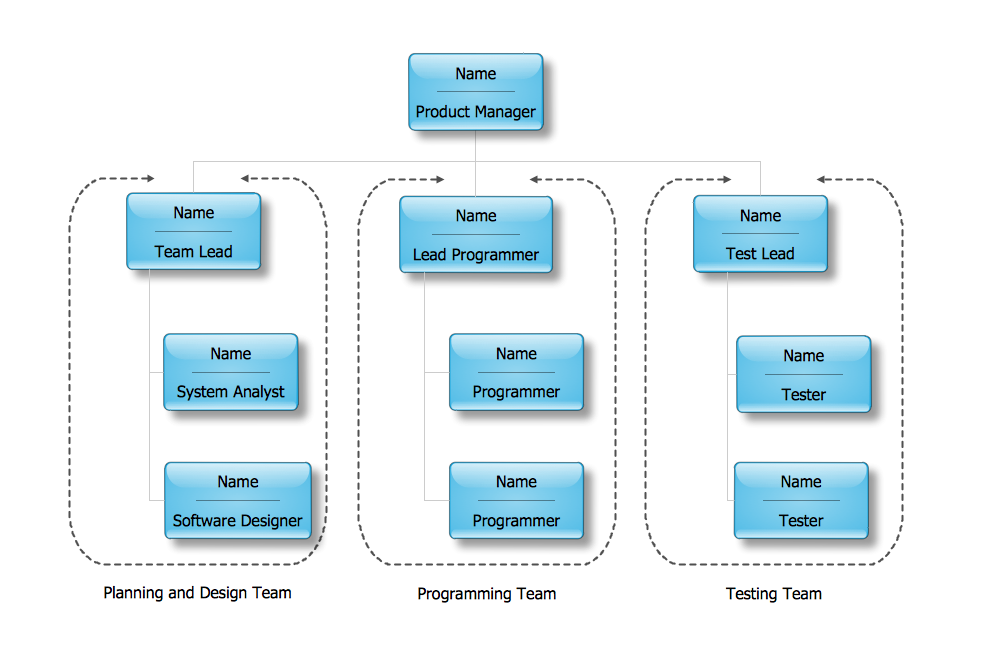
Example 1. Organizational Management

More convenient and easier to realize the organizational management activity when having a powerful software ConceptDraw DIAGRAM with 25 Typical Orgcharts Solution. It provides a number of tools for making professional looking organizational charts which will have a success always and anywhere - on presentations, conferences, in publications, etc.

25 Typical Orgcharts Solution in ConceptDraw STORE

Example 2. 25 Typical Orgcharts Solution in ConceptDraw STORE

25 Typical Orgcharts Solution contains the good base for organizational management - 10 samples and 25 different templates for making Organizational Chart of any structure you need. Open the ConceptDraw STORE to receive an access to this variety.

DOE Organizational Chart

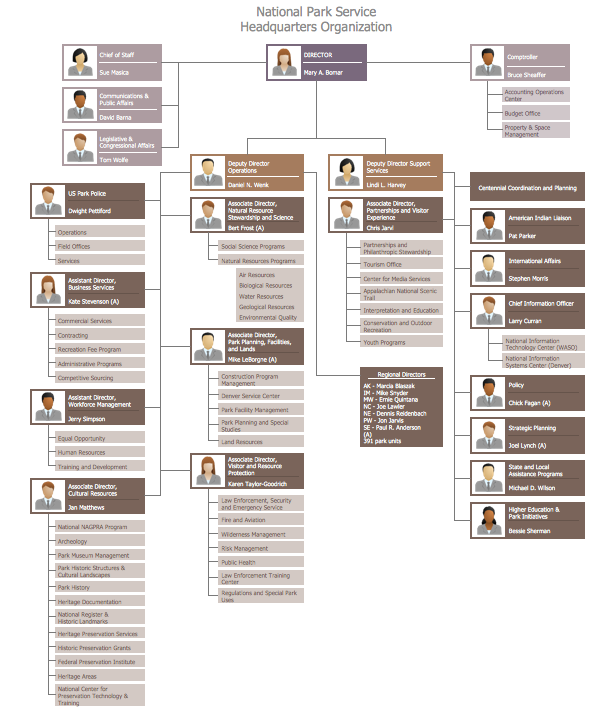
Example 3. DOE Organizational Chart

The Organizational Charts you see on this page were created in ConceptDraw DIAGRAM software using the tools of 25 Typical Orgcharts Solution. An experienced user spent 10 minutes creating every of these samples.

Use the 25 Typical Orgcharts Solution for ConceptDraw DIAGRAM software for effective organizational management, and fast and easy creating professional looking Organization Charts.

All source documents are vector graphic documents. They are available for reviewing, modifying, or converting to a variety of formats (PDF file, MS PowerPoint, MS Visio, and many other graphic formats) from the ConceptDraw STORE. The 25 Typical Orgcharts Solution is available for all ConceptDraw DIAGRAM users.


FOUR RELATED HOW TO's:
If you want to find a way to understand complex things in minutes, you should try to visualize data. One of the most useful tool for this is creating a flowchart, which is a diagram representing stages of some process in sequential order. There are so many possible uses of flowcharts and you can find tons of flow charts examples and predesigned templates on the Internet. Warehouse flowchart is often used for describing workflow and business process mapping. Using your imagination, you can simplify your job or daily routine with flowcharts. Warehouse flowcharts are used to document product and information flow between sources of supply and consumers. The flowchart provides the staged guidance on how to manage each aspect of warehousing and describes such aspects as receiving of supplies; control of quality; shipment and storage and corresponding document flow. Warehouse flowchart, being actual is a good source of information. It indicates the stepwise way to complete the warehouse and inventory management process flow. Also it can be very useful for an inventory and audit procedures.Warehouse Flowchart
Picture: Flow Chart Example: Warehouse Flowchart
Related Solution:
This sample was created in ConceptDraw DIAGRAM diagramming and vector drawing software using the Organizational Charts Solution from the Software Development area of ConceptDraw Solution Park. This sample shows the organizational chart in the field of Architect Engineering. Create your own orgchart professional drawings using ConceptDraw.Business Board Org Chart *
Picture: Business Board Org Chart
Related Solution:
While creating flowcharts and process flow diagrams, you should use special objects to define different statements, so anyone aware of flowcharts can get your scheme right. There is a short and an extended list of basic flowchart symbols and their meaning. Basic flowchart symbols include terminator objects, rectangles for describing steps of a process, diamonds representing appearing conditions and questions and parallelograms to show incoming data. This diagram gives a general review of the standard symbols that are used when creating flowcharts and process flow diagrams. The practice of using a set of standard flowchart symbols was admitted in order to make flowcharts and other process flow diagrams created by any person properly understandable by other people. The flowchart symbols depict different kinds of actions and phases in a process. The sequence of the actions, and the relationships between them are shown by special lines and arrows. There are a large number of flowchart symbols. Which of them can be used in the particular diagram depends on its type. For instance, some symbols used in data flow diagrams usually are not used in the process flowcharts. Business process system use exactly these flowchart symbols.Flowchart example showing a customer request approval process with start, input output, process steps, decision branches, and end
Picture: Flowchart Symbols: Meaning and Examples
Related Solution:
ConceptDraw DIAGRAM software enhanced with Organizational charts solution is an essential tool to ✔️ show the internal structure of an organization, ✔️ outline the hierarchy, ✔️ display key roles or job titles, ✔️ show relationships among employees or departments, ✔️ facilitate communication and cooperation, ✔️ visualize reporting relationshipsOrganization Chart Software
Picture: Organization Chart Software: A Comprehensive Guide
Related Solution:
ConceptDraw
DIAGRAM 18