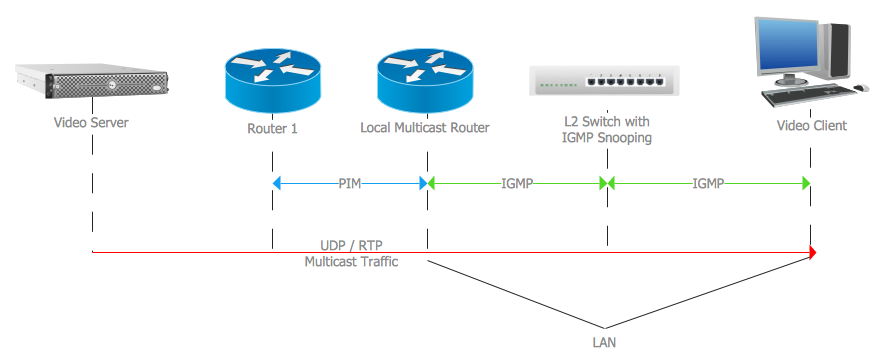
Example 1. IGMP
This example was redesigned from the file [https://commons.wikimedia.org]
Using the solutions of the Computer and Networks Area for ConceptDraw DIAGRAM you can create your own computer network diagrams quick and easy.
The diagrams designed with ConceptDraw DIAGRAM are vector graphic documents and are available for reviewing, modifying, and converting to a variety of formats (image, HTML, PDF file, MS PowerPoint Presentation, Adobe Flash or MS Visio).
See also Samples:
EIGHT RELATED HOW TO's:
Using the predesigned objects, templates and samples of the Computer and Networks Solution for ConceptDraw DIAGRAM you can create your own professional Computer Network Diagrams quick and easy.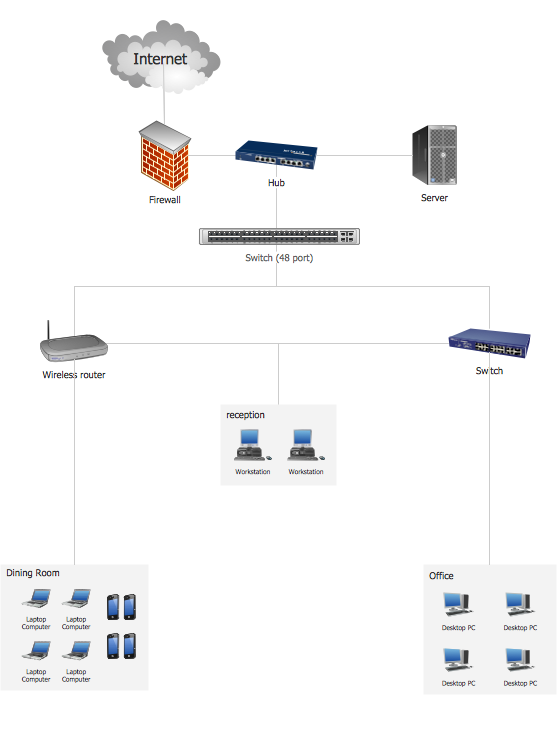
Picture: Hotel Network Topology
Related Solution:
The Internet Connectivity of the computers, mobile devices, computer networks to the Internet enables the users to access the various Internet services. There are many ways and technologies of the connection to the Internet with different data signaling rates: Wireless, Ethernet cable, Optical fiber, Dial-up, DSL, broadband Internet access, etc.
This example was created in ConceptDraw DIAGRAM using the Computer and Networks solution from the Computer and Networks area of ConceptDraw Solution Park and shows how the customers connect to ISPs and ISPs connect between the tiers (peering and transit).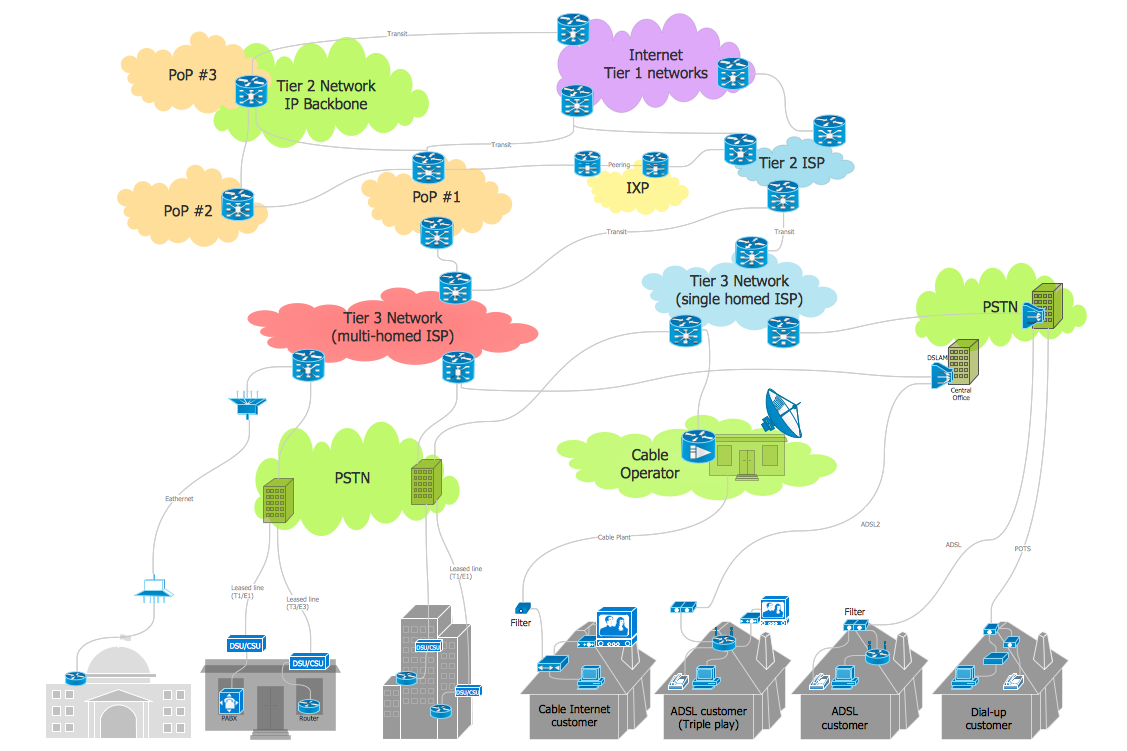
Picture: Internet Connectivity. Computer and Network Examples
Related Solution:
The Process Flowchart or Process Flowchart Diagram (PFD) is a visual representation relations between major parts of the system, the steps in a process, and even connections between various systems. The possibility to easy create professional-looking and attractive Process Flowcharts, Business Process Diagrams and Maps which visualize the steps of complex processes is provided by Business Process Diagram Solution from the Business Processes Area of ConceptDraw Solution Park and 16 libraries with 230 process flowchart symbols from BPMN 1.2 and BPMN 2.0.
Picture: Process Flowchart Symbols
Related Solution:
ConceptDraw MINDMAP an Alternative to MindJet MindManager - The power, economy, and versatility of ConceptDraw MINDMAP takes personnel and team productivity to another level. Discover today what this means to you.
Picture: Why People Select ConceptDraw MINDMAP
Related Solution:
This sample was created in ConceptDraw DIAGRAM diagramming and vector drawing software using the Computer and Networks solution from Computer and Networks area of ConceptDraw Solution Park.
A communication network topology is defined by the evaluating costs of the states. Each state represents the possible distribution of the hubs and remote nodes to nodes of the communication network.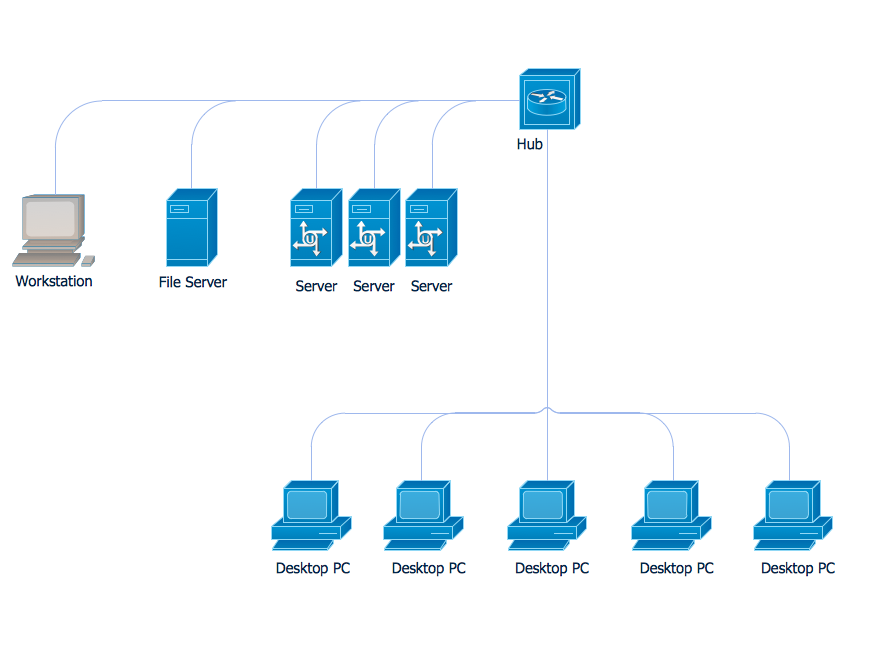
Picture: Communication Network Topology
Related Solution:
A Virtual network is a computer network that consists of virtual network links, i.e. between the computing devices there isn't a physical connection.
Well known forms of network virtualization are virtual networks based on the virtual devices (for example the network based on the virtual devices inside a hypervisor), protocol-based virtual networks (VLAN, VPN, VPLS, Virtual Wireless network, etc.) and their combinations.
This example was created in ConceptDraw DIAGRAM using the Computer and Networks Area of ConceptDraw Solution Park and shows the Virtual network.
Picture: Virtual networks. Computer and Network Examples
Related Solution:
There are several basic topologies including bus, star, point-to-point, ring and a hybrid. Two computers can form a fully connected network topology, and as the number of network nodes increases, the network diagram gets more complicated. This type of topology is also called a full mesh.
This is a visual example of a computer network built using a mesh topology. This diagram presents the schematic structure of the full mesh network topology. A common mesh network topology means that each network device is connected with several points in the network, so if the one node of the network goes down, it does not cause an issue with an operability of the entire computer network. In a full mesh network topology, every computer or device in the network is interconnected with each of the other devices in the network.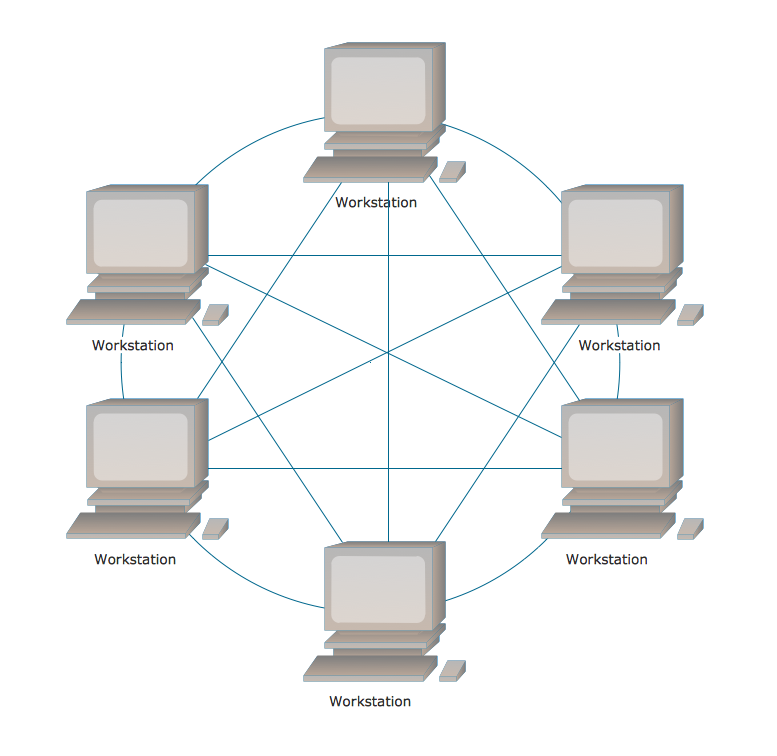
Picture: Fully Connected Network Topology Diagram
Related Solution:
Interactive Voice Response (IVR) is a system of the prerecorded voice messages that allows a computer to interact with humans. IVR performs the function of the routing calls within a call center, using the information entered by the customer on the phone keypad in the touchtone mode.
This example was created in ConceptDraw DIAGRAM using the Computer and Networks Area of ConceptDraw Solution Park and show the Interactive Voice Response (IVR) network.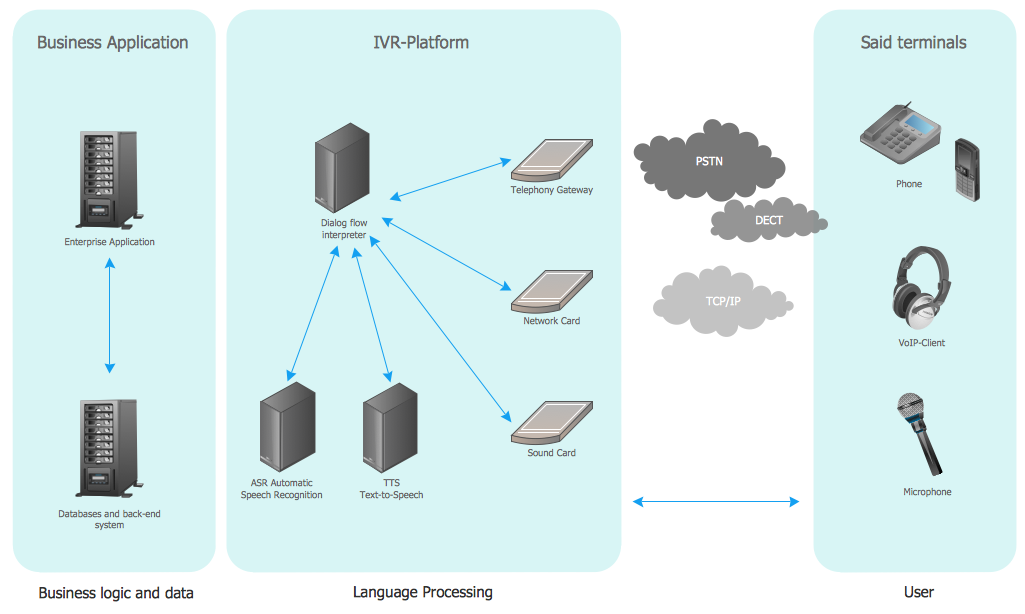
Picture: Interactive voice response (IVR) networks. Computer and Network Examples
Related Solution: