Made with
ConceptDraw
DIAGRAM 18

EPC Engineering

ConceptDraw DIAGRAM is a powerful diagramming and vector drawing software. Extended with Event-driven Process Chain Diagrams EPC solution from the Business Processes Area, ConceptDraw DIAGRAM became the ideal EPC Engineering software.

EPC Engineering *

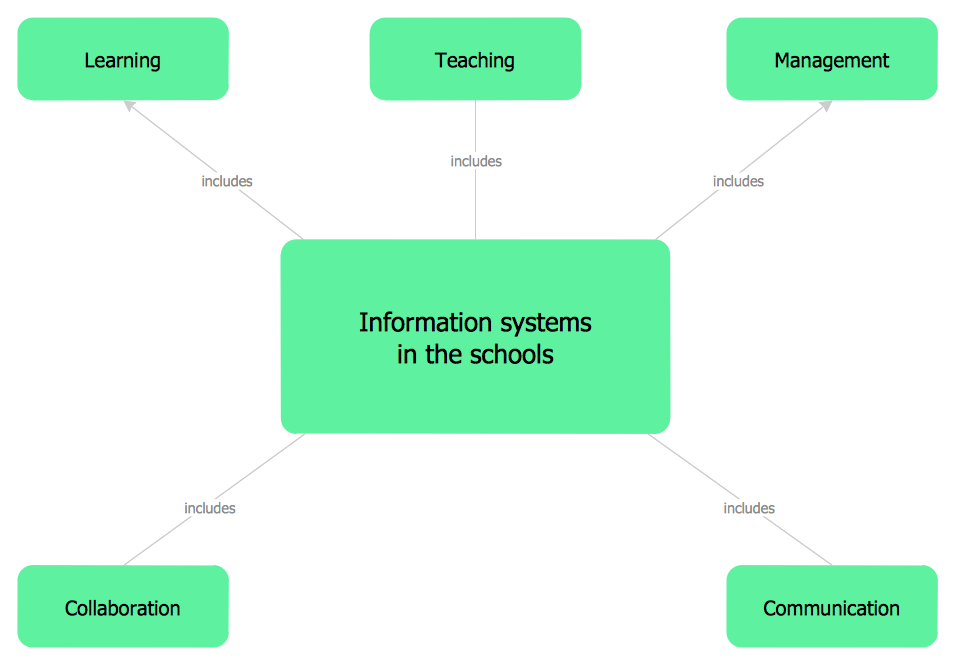
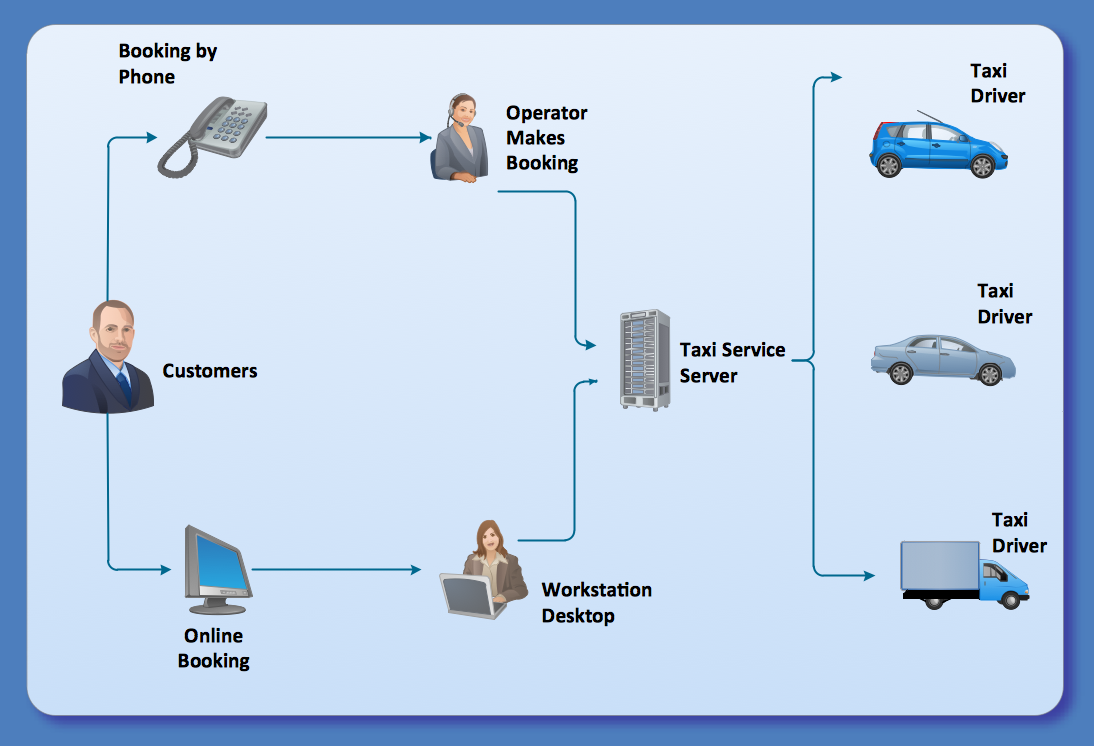
Example 1. EPC Engineering in ConceptDraw DIAGRAM /p>

Event-driven Process Chain Diagrams EPC Solution offers the EPC Diagrams library with variety of predesigned vector shapes. Thanks to them the process of EPC engineering in ConceptDraw DIAGRAM is very simple.

EPC Diagrams Library Design Elements

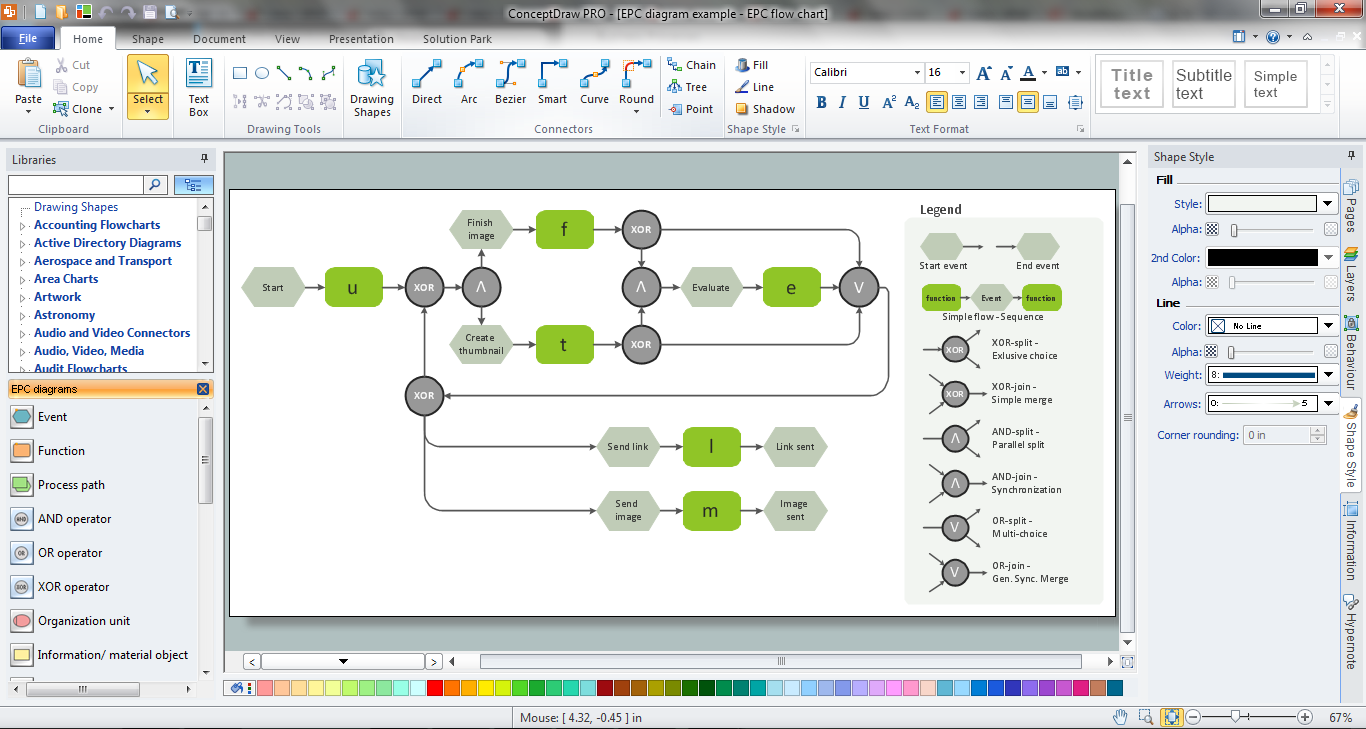
Example 2. EPC Diagrams Library Design Elements

All that you need is simply drag the desired shapes from the library to your document, arrange them, add color background, type the text and title to get the excellent result – your own EPC diagram in minutes. It’s very fast and easy way of drawing, and the most important – you don’t need to be the painter for this.

Event-driven Process Chain Diagrams EPC Solution in ConceptDraw STORE

Example 3. Event-driven Process Chain Diagrams EPC Solution in ConceptDraw STORE

Use also a variety of samples and templates included in the Event-driven Process Chain Diagrams EPC Solution and available from ConceptDraw STORE.

EPC Diagram - Login and Registration Processing

Example 4. EPC Diagram - Login and Registration Processing

The samples you see on this page were created in ConceptDraw DIAGRAM using the Event-driven Process Chain Diagrams EPC Solution for ConceptDraw DIAGRAM These samples successfully demonstrate solution's capabilities and professional results you can achieve. An experienced user spent 10 minutes creating each of them.

Use the Event-driven Process Chain Diagrams EPC Solution for ConceptDraw DIAGRAM software to create your own professional looking EPC diagrams of any complexity quick, easy and effective, and then successfully use them in your work activity.

All source documents are vector graphic documents. They are available for reviewing, modifying, or converting to a variety of formats (PDF file, MS PowerPoint, MS Visio, and many other graphic formats) from the ConceptDraw STORE. The Event-driven Process Chain Diagrams EPC Solution is available for all ConceptDraw DIAGRAM or later users.


THREE RELATED HOW TO's:
A transistor is a semiconductor device used to amplify or switch electronic signals and electrical power. It is composed of semiconductor material usually with at least three terminals for connection to an external circuit. A voltage or current applied to one pair of the transistor's terminals changes the current through another pair of terminals. Because the controlled (output) power can be higher than the controlling (input) power, a transistor can amplify a signal. Today, some transistors are packaged individually, but many more are found embedded in integrated circuits. 26 libraries of the Electrical Engineering Solution of ConceptDraw DIAGRAM make your electrical diagramming simple, efficient, and effective. You can simply and quickly drop the ready-to-use objects from libraries into your document to create the electrical diagram.Electrical Symbols — Transistors *
Picture: Electrical Symbols — Transistors
Related Solution:
It is impossible to imagine mechanical engineering without drawings which represent various mechanical schemes and designs. ConceptDraw DIAGRAM diagramming and vector drawing software supplied with Mechanical Engineering solution from the Engineering area of ConceptDraw Solution Park offers the set of useful tools which make it a powerful Mechanical Drawing Software.Mechanical Drawing Software *
Picture: Mechanical Drawing Software
Related Solution:
When we start to speak about databases, we must always mention database structure visualization. One of the most common ways to do it is to create an entity relationship diagram, and to put appropriate symbols on it. It is important either for database projecting and for its' future maintenance. Entity Relationship Diagram describes data elements and their relationships within a database. There are a set of special symbols that depict each element of an entity relationship diagram. Entities - represents some stable components such as supplier, employee, invoice, client, etc. Relation symbols show how the entities interact. Attributes define characteristics of the relationships. Attributes can be one-to-one or many-to-many. Physical symbols is used in the physical models. They represent items such as fields, tables, types and keys. ERD physical symbols are the building material for the database. Notation lines are used to illustrate the relationships. The most common method is Crow’s Feet notation. You can use ConceptDraw Entity-Relationship Diagram (ERD) solution to represent a database using the Entity-Relationship model.Entity Relationship Diagram Symbols
Picture: Entity Relationship Diagram Symbols
Related Solution:
ConceptDraw
DIAGRAM 18