Made with
ConceptDraw
DIAGRAM 18

Easy Flowchart Maker Free

The Flowchart is a way to show the steps of a process, workflow, some algorithm, or a simple program in an order in which they need to be executed. The boxes of the different kinds are used for the Flowchart drawing. They are connected with the arrows showing the order or logical sequence of steps. The processing steps are typically represented by rectangular boxes and decisions are depicted with the diamond shapes. In a Cross-Functional Flowchart, you have additionally the possibility to show the responsibilities. You can indicate a person, team, or department responsible for the execution of each step.

ConceptDraw DIAGRAM easy Flowchart maker free helps effectively in drawing Flowcharts in short terms and without efforts. The included Flowcharts solution offers all needed drawing tools for designing a truly professional-looking Flowchart.
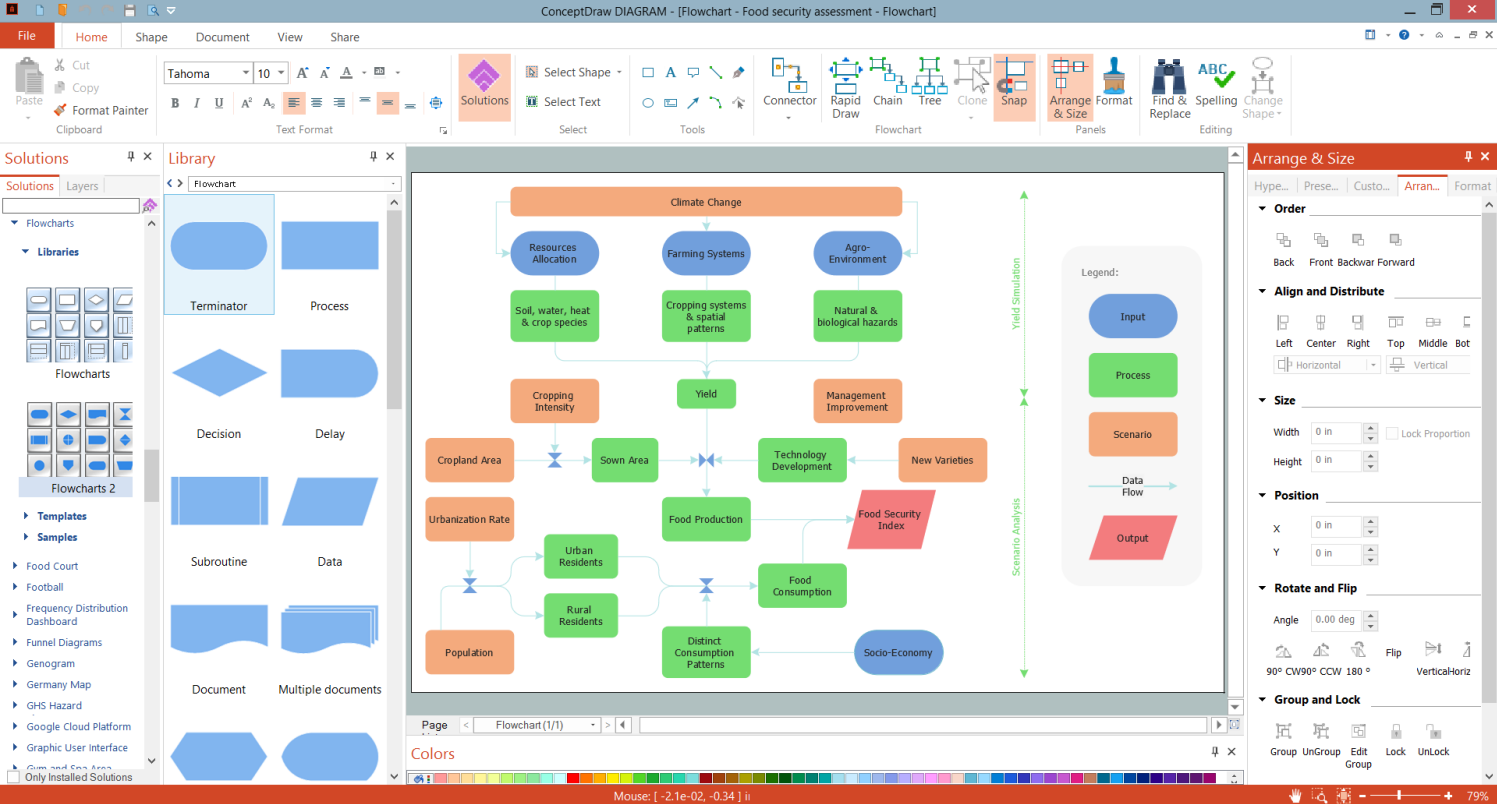
Easy Flowchart Maker Free

Example 1. Easy Flowchart Maker Free - ConceptDraw DIAGRAM

Flowcharts solution provides an impressive list of tools and predesigned samples. You can find among the samples the flowcharts made for the product life cycle process, invoice payment process, website launch, and many more. A quick-start template and libraries with a large number of predefined vector shapes and symbols are also included. They ideally suit for creating Flowcharts in minutes. All samples, template, and solution libraries are available at the ConceptDraw STORE.
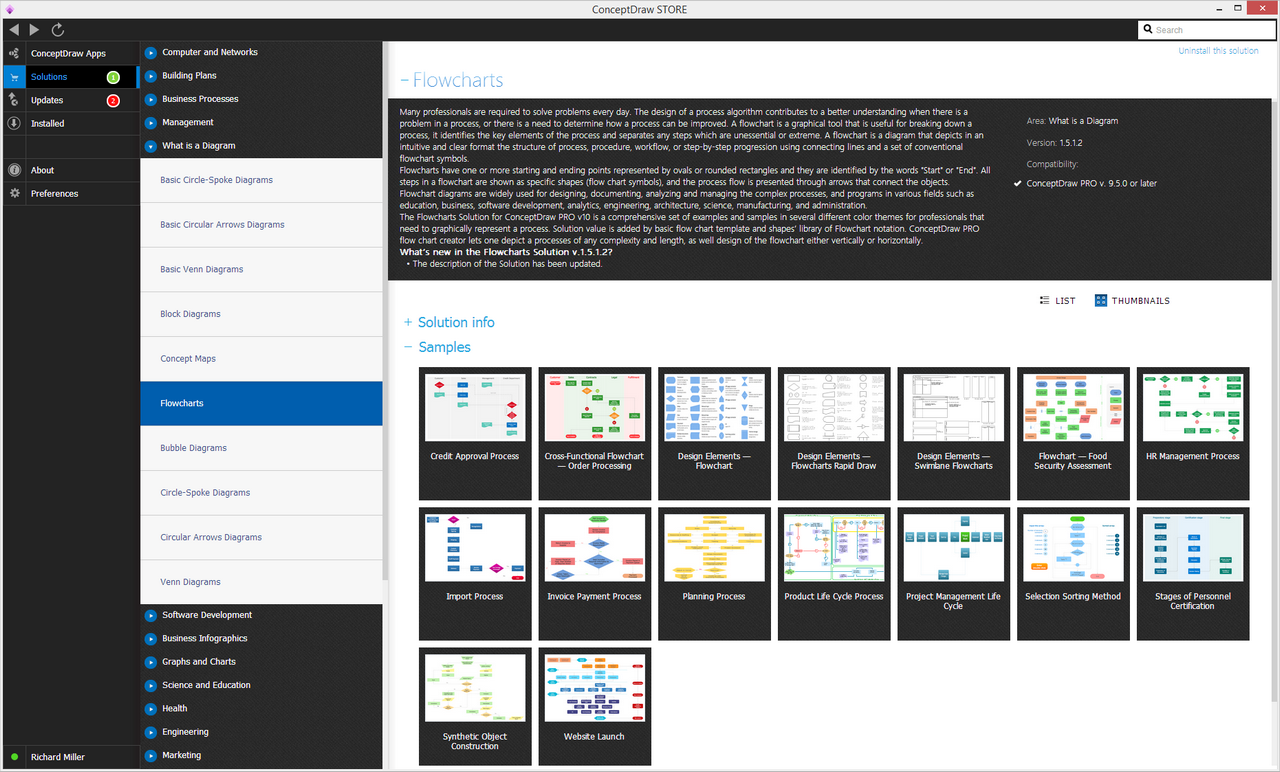
Flowcharts Solution in ConceptDraw STORE

Example 2. Flowcharts Solution in ConceptDraw STORE

The following features make ConceptDraw DIAGRAM the easy Flowchart maker free:

  1. You don't need to be an artist to draw professional-looking diagrams in a few minutes.
  2. Large quantity of ready-to-use vector objects makes your drawing diagrams quick and simple.
  3. Great number of predesigned templates and samples give you a good start for your own diagrams.
  4. ConceptDraw DIAGRAM provides you the possibility to use the grid, rules, and guides. You can easily rotate, group, align, arrange the objects, use different fonts and colors to make your diagram exceptionally looking.
  5. All ConceptDraw DIAGRAM documents are vector graphic files and are available for reviewing, modifying, and converting to a variety of formats: image, HTML, PDF file, MS PowerPoint Presentation, Adobe Flash, MS Visio.
  6. Using ConceptDraw STORE you can navigate through ConceptDraw Solution Park, managing downloads and updates. You can access libraries, templates, and samples directly from the ConceptDraw STORE.
  7. If you have any questions, our free of charge support is always ready to come to your aid.


FOUR RELATED HOW TO's:
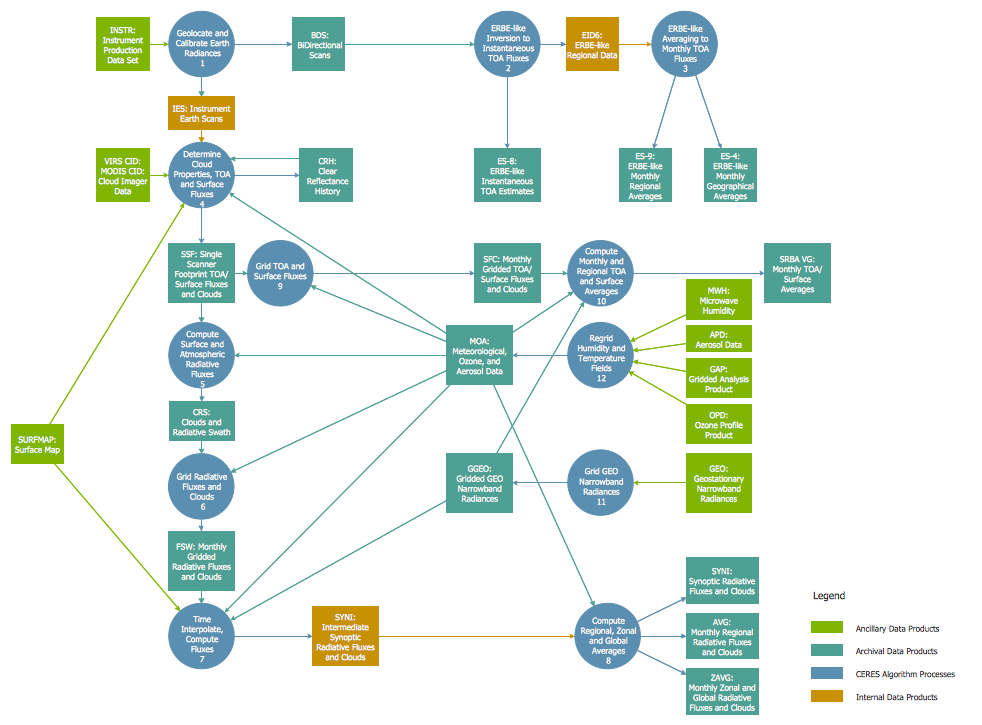
Every engineering project starts from a terms of reference document. The next stage of developing is a technical drawing, which requires using appropriate software. However, revisions and discussions about requirements are possible at any stage of development. This technical drawing demonstrates a schematic flow diagram of pulp reclaiming. This diagram of magnetite pulp reclaiming is created using ConceptDraw Chemical and Process engineering solution, The solution delivers more than 460 vector graphic icons and connectors. Generally, it is intended for designing process and instrumentation diagrams (P&ID) for chemical and process engineering. block flow diagrams (BFD), process flow diagrams (PFD) for chemical industry.Technical Drawing Software *
Picture: Technical Drawing Software
Related Solution:
ConceptDraw DIAGRAM is new software for business and technical drawing. Powerful business drawing tools, extensive libraries with pre-drawn shapes, free samples of business drawings, technical drawings and flowcharts, support of many graphic formats enable users to visually develop their business drawings charts and diagrams in any combination of drawings, diagrams and flow charts.ConceptDraw DIAGRAM The best Business Drawing Software *
Picture: ConceptDraw DIAGRAM The best Business Drawing Software
Related Solution:
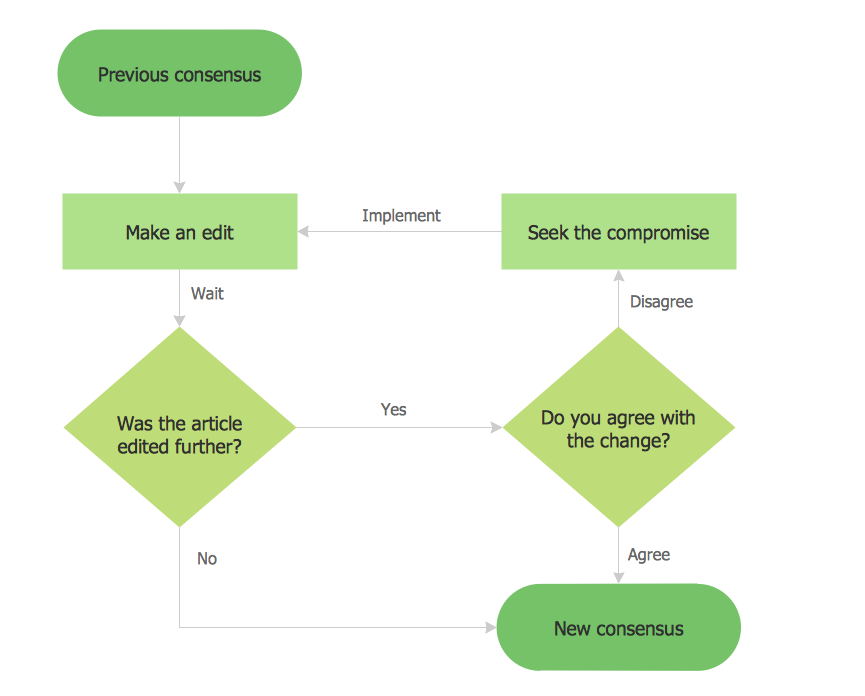
This sample shows the Flowchart that displays the process of the achievement the consensus, in other words solving for the acceptable solution. This Flowchart has start point. The rectangles on it represent the steps of the process and are connected with arrows that show the sequence of the actions. The diamonds with yes/no shows the decisions. The Flowcharts are widely used in marketing, business, analytics, government, politics, engineering, architecture, science, manufacturing, administration, etc.Example Basic Flowchart. Flowchart Examples
Picture: Example Basic Flowchart. Flowchart Examples
Related Solution:
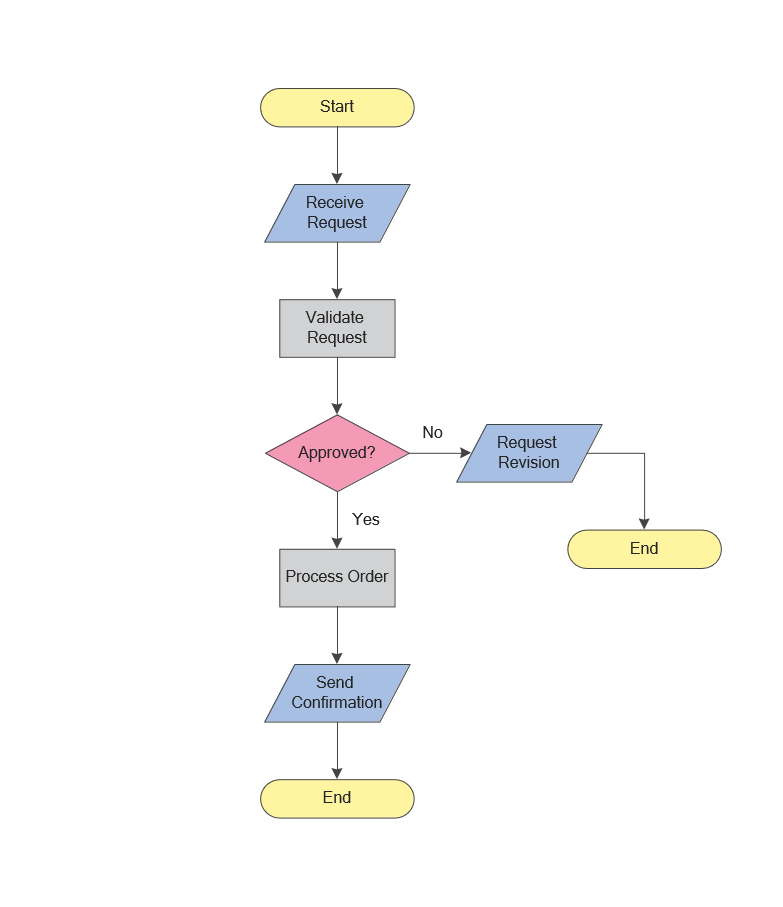
While creating flowcharts and process flow diagrams, you should use special objects to define different statements, so anyone aware of flowcharts can get your scheme right. There is a short and an extended list of basic flowchart symbols and their meaning. Basic flowchart symbols include terminator objects, rectangles for describing steps of a process, diamonds representing appearing conditions and questions and parallelograms to show incoming data. This diagram gives a general review of the standard symbols that are used when creating flowcharts and process flow diagrams. The practice of using a set of standard flowchart symbols was admitted in order to make flowcharts and other process flow diagrams created by any person properly understandable by other people. The flowchart symbols depict different kinds of actions and phases in a process. The sequence of the actions, and the relationships between them are shown by special lines and arrows. There are a large number of flowchart symbols. Which of them can be used in the particular diagram depends on its type. For instance, some symbols used in data flow diagrams usually are not used in the process flowcharts. Business process system use exactly these flowchart symbols.Flowchart example showing a customer request approval process with start, input output, process steps, decision branches, and end
Picture: Flowchart Symbols: Meaning and Examples
Related Solution:
ConceptDraw
DIAGRAM 18