HelpDesk
How to Design a Mockup of Apple macOS Sierra GUI
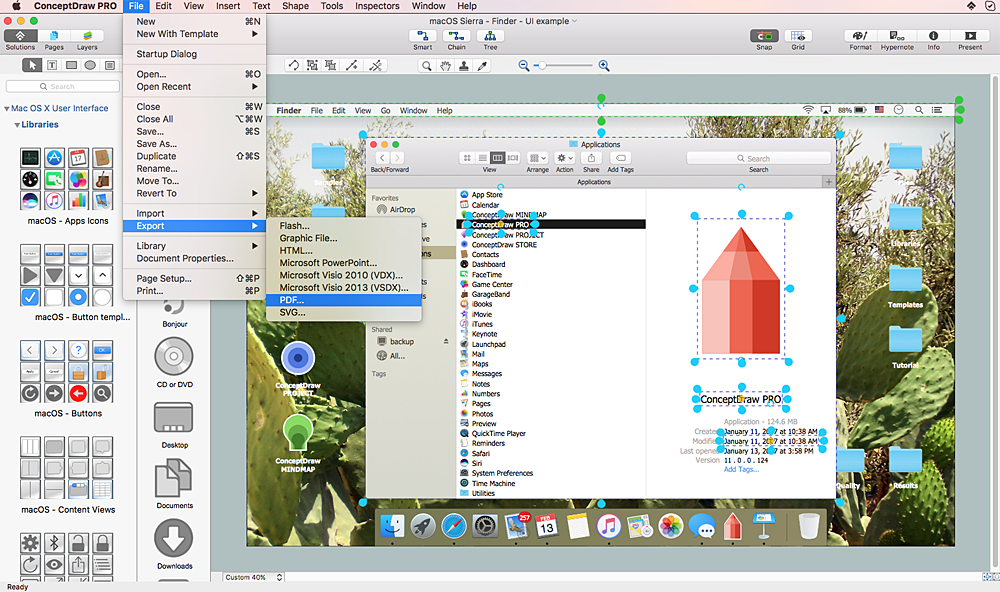
Since that first Macintosh, Apple have always developed and used their own hardware specific operating system. The fundamental style and layout of the Mac OS X user interface has remained largely in place since the earliest versions, but there have been obvious aesthetic enhancements, and elements of icon redesign to match branding across devices. To design an effective user interface, graphic designers will create visual GUI prototypes, that focus on maximizing the user experience. Uses Interface prototyping is much convenient when you can work through a diagram similar to the OS X design. ConceptDraw PRO allows you to develop Apple OS X User Interface (UI) prototypes using the special templates and vector libraries of the specific user interface elements. ConceptDraw Mac OS X UI solution offers libraries containing the distinct Mac app icons, menu bar graphics, glyph elements and other Mac OS X features — everything necessary to create high standard, professional UI graphic desig
 IDEF0 Diagrams
IDEF0 Diagrams visualize system models using the Integration Definition for Function Modeling (IDEF) methodology. Use them for analysis, development and integration of information and software systems, and business process modelling.
 What are Infographics Area
Solutions of the area What is Infographics from ConceptDraw Solution Park collect templates, samples and vector stencils libraries with design elements for the drawing information graphics.
 Basic Divided Bar Diagrams
This solution extends the capabilities of ConceptDraw PRO v10.3.0 (or later) with templates, samples and a library of vector stencils for drawing Divided Bar diagrams.
 Entity-Relationship Diagram (ERD)
An Entity-Relationship Diagram (ERD) is a visual presentation of entities and relationships. That type of diagrams is often used in the semi-structured or unstructured data in databases and information systems. At first glance ERD is similar to a flowch
 Business and Finance
Use Business and Finance solution to make professional-looking documents, presentations and websites, business, finance, advertising, and project management illustrations, or any designs that requires clipart of currency, office, business, advertising, management, marketing, people, time, post, contacts, collaboration, etc.
 Circular Arrows Diagrams
Circular Arrows Diagrams solution extends ConceptDraw PRO v10 with extensive drawing tools, predesigned samples, Circular flow diagram template for quick start, and a library of ready circular arrow vector stencils for drawing Circular Arrow Diagrams, Segmented Cycle Diagrams, and Circular Flow Diagrams. The elements in this solution help managers, analysts, business advisers, marketing experts, scientists, lecturers, and other knowledge workers in their daily work.
- Entity Relationship Diagram Examples | How To Stylish Topologies ...
- Interior Design Office Layout Plan Design Element | Stylish Sofa ...
- How to Add a Flowchart to a MS Word Document Using ...
- Basic Flowchart Symbols and Meaning | How to Convert a Mind Map ...
- Basic Flowchart Symbols and Meaning | Divided Bar Diagrams ...
- Design elements - Timelines and milestones | Timelines and ...
- Basic Flowchart Symbols and Meaning | How to Draw a Divided Bar ...
- How to Draw a Divided Bar Chart in ConceptDraw PRO | Basic ...
- How to Draw a Divided Bar Chart in ConceptDraw PRO | Basic ...
- How to Draw a Divided Bar Chart in ConceptDraw PRO | Basic ...
- Flow chart Example. Warehouse Flowchart | Data Flow Diagrams ...
- Basic Flowchart Symbols and Meaning | Program Evaluation and ...
- PM Docs | Process Flowchart | Gather Requirements Exchanging ...
- How to Add a Cross-Functional Flowchart to an MS Word Document ...
- Basic Flowchart Symbols and Meaning | ConceptDraw Solution Park ...
- Work Flow Chart | Workflow Diagram Software | Types of Flowcharts ...
- Process Flowchart | Flow chart Example. Warehouse Flowchart ...
- Cross-Functional Flowchart | Process Flowchart | How To Convert ...
- How to Draw a Divided Bar Chart in ConceptDraw PRO | Basic ...
