A four level pyramid model of different types of Information Systems based on the different levels of hierarchy in an organization. The first level represents transaction processing systems for workers. The second level represents management information systems for middle managers. The third level represents decision support systems for senior menegers. The fourth level represents executive information systems for executives.
"The "classic" view of Information systems found in the textbooks in the 1980s was of a pyramid of systems that reflected the hierarchy of the organization, usually transaction processing systems at the bottom of the pyramid, followed by management information systems, decision support systems, and ending with executive information systems at the top. Although the pyramid model remains useful, since it was first formulated a number of new technologies have been developed and new categories of information systems have emerged, some of which no longer fit easily into the original pyramid model.
Some examples of such systems are:
data warehouses,
enterprise resource planning,
enterprise systems,
expert systems,
search engines,
geographic information system,
global information system,
office automation." [Information systems. Wikipedia]
This diagram was redesigned using the ConceptDraw PRO diagramming and vector drawing software from Wikimedia Commons file Four-Level-Pyramid-model.png. [commons.wikimedia.org/ wiki/ File:Four-Level-Pyramid-model.png]
This file is licensed under the Creative Commons Attribution-Share Alike 3.0 Unported license. [creativecommons.org/ licenses/ by-sa/ 3.0/ deed.en]
The triangle chart example "Information systems types" is included in the Pyramid Diagrams solution from the Marketing area of ConceptDraw Solution Park.
Pyramid diagram

A five level pyramid model of different types of Information Systems based on the information processing requirement of different levels in the organization. The first level represents transaction processing systems to process basic data. The second level represents office support systems to process information in office. The third level represents management information systems to process information by managers. The fourth level represents decision support systems to process explicit knowledge. The fifth level represents executive information systems to process tacit knowledge.
"A Computer(-Based) Information System is essentially an IS using computer technology to carry out some or all of its planned tasks. The basic components of computer based information system are:
(1) Hardware - these are the devices like the monitor, processor, printer and keyboard, all of which work together to accept, process, show data and information.
(2) Software - are the programs that allow the hardware to process the data.
(3) Databases - are the gathering of associated files or tables containing related data.
(4) Networks - are a connecting system that allows diverse computers to distribute resources.
(5) Procedures - are the commands for combining the components above to process information and produce the preferred output.
The first four components (hardware, software, database and network) make up what is known as the information technology platform. Information technology workers could then use these components to create information systems that watch over safety measures, risk and the management of data. These actions are known as information technology services." [Information systems. Wikipedia]
This pyramid diagram was redesigned using the ConceptDraw PRO diagramming and vector drawing software from Wikimedia Commons file Five-Level-Pyramid-model.png. [commons.wikimedia.org/ wiki/ File:Five-Level-Pyramid-model.png]
This file is licensed under the Creative Commons Attribution 3.0 Unported license. [creativecommons.org/ licenses/ by/ 3.0/ deed.en]
The triangle chart example "Information systems types" is included in the Pyramid Diagrams solution from the Marketing area of ConceptDraw Solution Park.
Pyramid diagram

HelpDesk
How to Draw a Pyramid Diagram in ConceptDraw PRO

 Pyramid Diagrams
Pyramid Diagrams solution extends ConceptDraw PRO software with templates, samples and library of vector stencils for drawing the marketing pyramid diagrams.
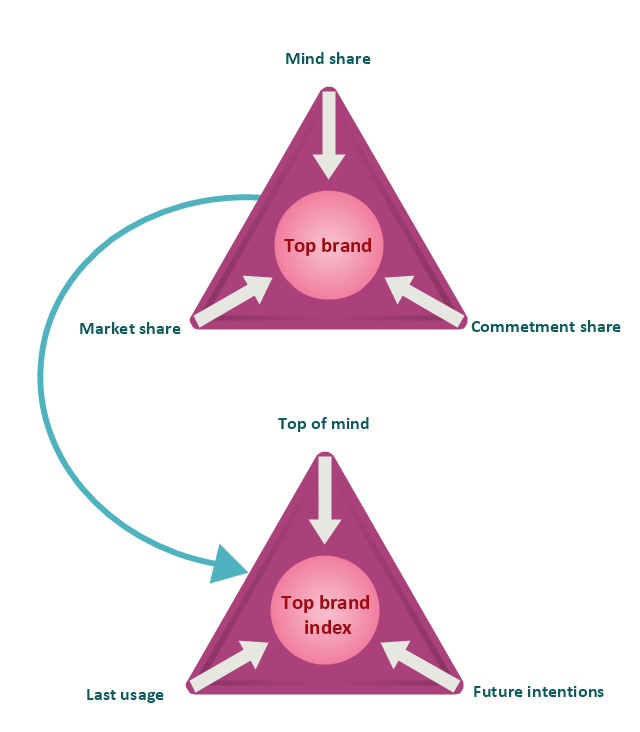
"Brand awareness refers to customers' ability to recall and recognize the brand under different conditions and link to the brand name, logo, jingles and so on to certain associations in memory. It consists of both brand recognition and brand recall. It helps the customers to understand to which product or service category the particular brand belongs and what products and services are sold under the brand name. It also ensures that customers know which of their needs are satisfied by the brand through its products (Keller). Brand awareness is of critical importance since customers will not consider your brand if they are not aware of it. There are various levels of brand awareness that require different levels and combinations of brand recognition and recall. Top-of-Mind is the goal of most companies. Top-of-mind awareness occurs when your brand is what pops into a consumers mind when asked to name brands in a product category." [Brand. Brand awareness. Wikipedia]
This top brand model pyramid diagram was redesigned using the ConceptDraw PRO diagramming and vector drawing software from Wikimedia Commons file Diagram Top Brand Model.jpg. [commons.wikimedia.org/ wiki/ File:Diagram_ Top_ Brand_ Model.jpg]
This file is licensed under the Creative Commons Attribution-Share Alike 3.0 Unported license. [creativecommons.org/ licenses/ by-sa/ 3.0/ deed.en]
The example "Top brand model pyramid diagram" is included in the Pyramid Diagrams solution from the Marketing area of ConceptDraw Solution Park.
Triangular charts
 UK Map
The Map of UK solution contains collection of professionally designed samples and scalable vector stencil graphics maps, representing the United Kingdom counties, regions and cities. Use the Map of UK solution from ConceptDraw Solution Park as the base fo
 Bubble Diagrams
Bubble diagrams have enjoyed great success in software engineering, architecture, economics, medicine, landscape design, scientific and educational process, for ideas organization during brainstorming, for making business illustrations, presentations, planning, design, and strategy development. They are popular because of their simplicity and their powerful visual communication attributes.
- 5 level pyramid model diagram of information systems types ...
- Pyramid Diagram | Pyramid Diagram | 4 Level pyramid model ...
- 3 level pyramid model diagram of information systems types | 5 level ...
- Pyramid Diagram | 4 level pyramid model diagram of information ...
- 5 level pyramid model diagram of information systems types
- Pyramid Diagram | 5- level 3D pyramid diagram template | Pyramid ...
- Value pyramid - Marketing diagram | Pyramid Diagrams | Social ...
- Pyramid Diagram | 4 level pyramid model diagram of information ...
- Pyramid Concept Map
- 3 level pyramid model diagram of information systems types | 4 level ...
- Pyramid Diagram
- 4 Level pyramid model diagram - Information systems types
- Pyramid Diagram | 5 level pyramid model diagram of information ...
- Pyramid Diagram | Pyramid Diagram | Pyramid Diagram | Four Level
- Pyramid Diagram | 4 Level pyramid model diagram - Information ...
- 5 level pyramid model diagram of information systems types | 4 level ...
- 3 Level pyramid model diagram - Information systems types
- Pyramid Diagram
- 5 level pyramid model diagram of information systems types | 3 level ...
- Pyramid Diagram