HelpDesk
How to Create a Timeline Diagram in ConceptDraw PRO
A Timeline is a chart which displays a project plan schedule in chronological order. A Timeline is used in project management to depict project milestones and visualize project phases, and show project progress. The graphic form of a timeline makes it easy to understand critical project milestones, such as the progress of a project schedule. Timelines are particularly useful for project scheduling or project management when accompanied with a Gantt chart. It captures the main of what the project will accomplish and how it will be done. making a project timeline is one of the most important skills a project manager needs have. Making comprehensive, accurate timelines allows you getting every project off in the best way. ConceptDraw PRO allows you to draw a timeline charts using special library.HelpDesk
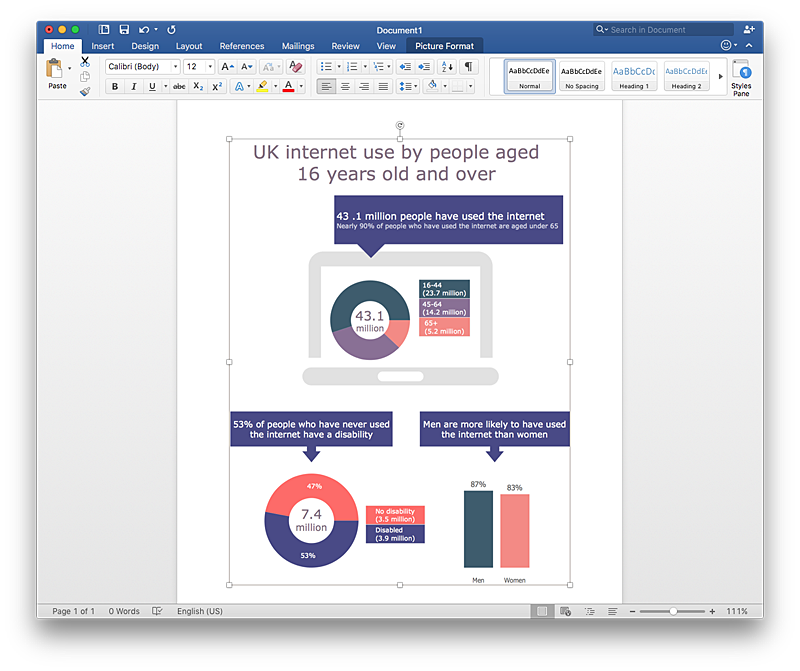
How to Add Data-driven Infographics to a MS Word Document Using ConceptDraw PRO
Infographics ae usually used as an effective way of showing a certain portion of information . There are a wide of range of subjects that can be represented in a such way. One of the most simple usage for the infographics, in business diagrams. Sales staff can use it as an effective method of sharing the sales results with the entire team and stakeholders. ConceptDraw Data-driven Infographics solution gives all the tools one need to present a certain type of data. ConceptDraw PRO allows you to easily create data-driven infographics and then insert them into a MS Word document.HelpDesk
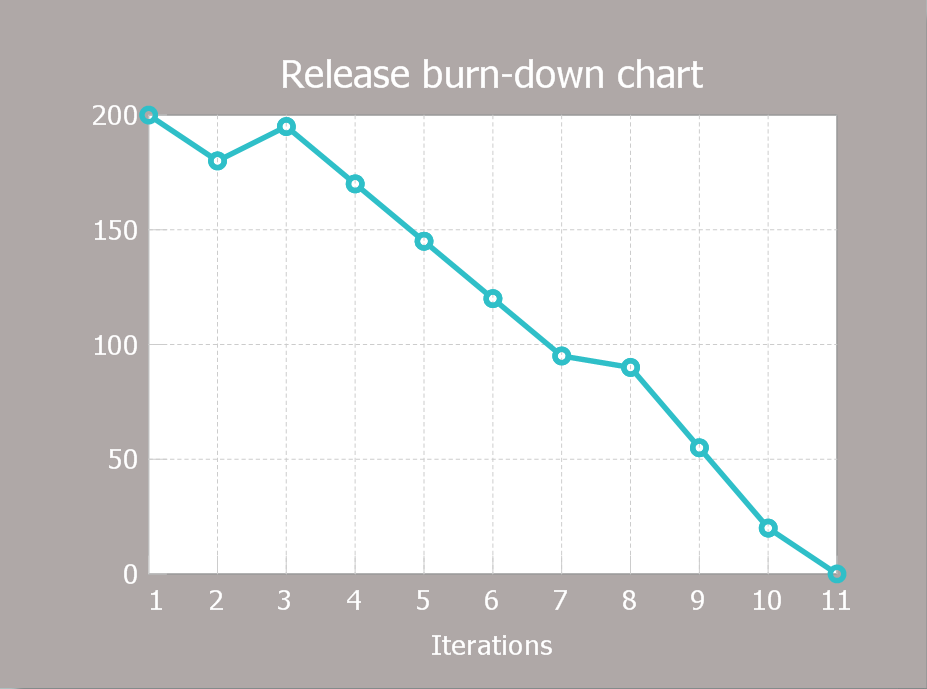
How to Create a Release Burn-Down Chart Using ConceptDraw PRO
The Agile methodology provides project teams the ability to quickly adapt the project to the current situation and thus achieve maximum productivity. According the Scrum method the steps needed to fulfill the project goal breaks down by using short sprints or iterations. The iterations together with an extensive collaboration can increase productivity by better understanding the entire flow of a project. A release burn-down chart is used to track a progress on a Scrum project. The ConceptDraw Scrum Workflow Solution makes it easy for Agile project team to build any professional Scrum diagram such as a Release velocity chart, Release burn-down chart, Sprint burn-down chart, or a Team velocity chart.Business Process Elements: Events
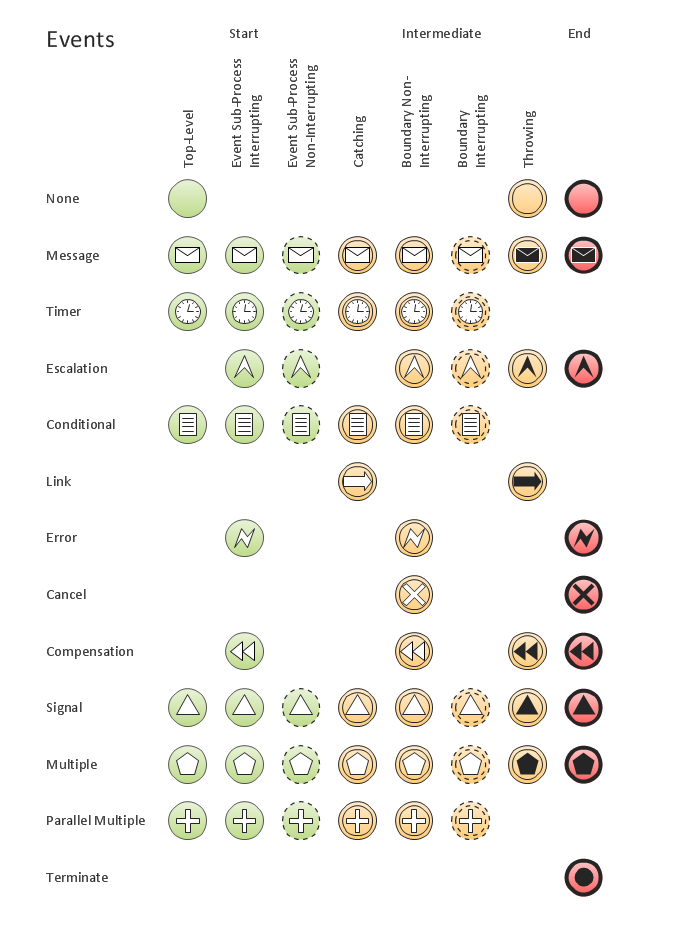
Create professional business process diagrams using ConceptDraw Events library with 17 objects from BPMN.
 Scrum Workflow
The Scrum Workflow Solution extends the capabilities of ConceptDraw PRO 10 with a large collection of professionally-designed samples and a selection of ready-to-use scrum design elements: scrum diagrams and arrows, scrum icons of people, artifacts, workflow, workspace and other colorful scrum clipart, and also scrum charts.
- How To Create a Visio Circle -Spoke Diagram Using ConceptDraw ...
- PM Agile | Agile Methodology | SSADM Diagram | Agile Visio Stencils
- Circle Charting Shape Visio
- Visio Agile Template
- Pro Circle Stencil
- Business Report Pie. Pie Chart Examples | Target and Circular ...
- How To Use Visio To Create Velocity Chart
- How To Show Project Progress Peport on Web | Status indicators ...
- Export from ConceptDraw PRO Document to a Graphic File | How to ...
- Timeline Template Visio
- Computer network - Vector stencils library | Education pictograms ...
- Visio Timeline Templates
- Cross Functional Flowchart Shapes Stencil | Mac OS X buttons and ...
- Cross-Functional Flowchart | Industrial equipment - Vector stencils ...
- Visio Timeline Examples
- Visio Project Timeline Template
- Window elements - Vector stencils library | OS X 10.10 Yosemite ...
- VoIP call with SIM box and gateway | Flowchart design. Flowchart ...
- Agile Methodology | PM Agile | Scrum | Diagram Visio Agile Process


