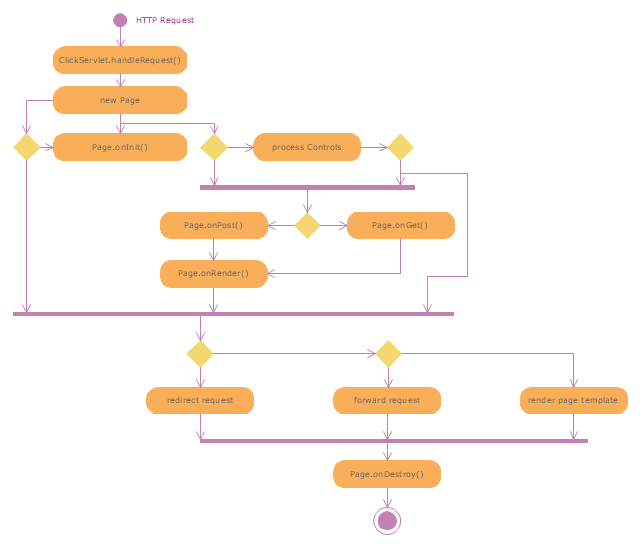
"Web container (also known as a Servlet container) is the component of a web server that interacts with Java servlets. A web container is responsible for managing the lifecycle of servlets, mapping a URL to a particular servlet and ensuring that the URL requester has the correct access rights. A web container implements the web component contract of the Java EE architecture, specifying a runtime environment for web components that includes security, concurrency, lifecycle management, transaction, deployment, and other services. A web container provides the same services as a JSP container as well as a federated view of the Java EE platform APIs." [Web container. Wikipedia]
The UML activity diagram example "Servlet container" was created using the ConceptDraw PRO diagramming and vector drawing software extended with the Rapid UML solution from the Software Development area of ConceptDraw Solution Park.
The UML activity diagram example "Servlet container" was created using the ConceptDraw PRO diagramming and vector drawing software extended with the Rapid UML solution from the Software Development area of ConceptDraw Solution Park.
UML activity diagram
 Rapid UML
Rapid UML solution extends ConceptDraw PRO software with templates, samples and libraries of vector stencils for quick drawing the UML diagrams using Rapid Draw technology.
 Rapid UML
Rapid UML solution extends ConceptDraw PRO software with templates, samples and libraries of vector stencils for quick drawing the UML diagrams using Rapid Draw technology.
Data structure diagram with ConceptDraw PRO

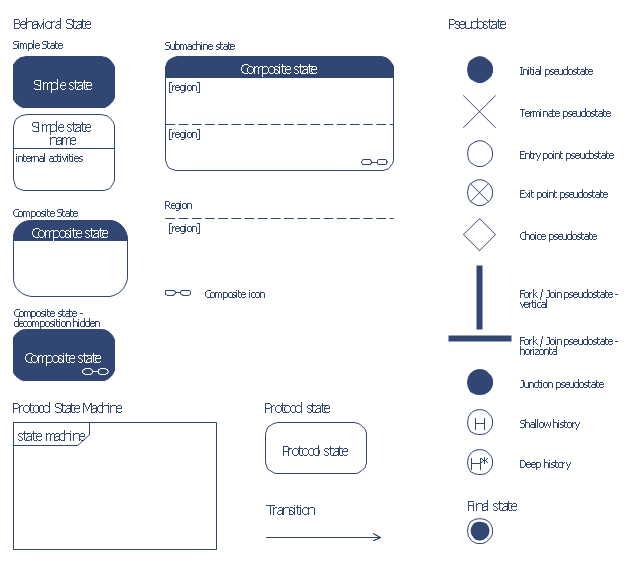
The vector stencils library "Bank UML state machine diagram" contains 21 shapes for drawing UML state machine diagrams.
Use it for object-oriented modeling of your bank information system.
"The state diagram in the Unified Modeling Language is essentially a Harel statechart with standardized notation, which can describe many systems, from computer programs to business processes. In UML 2 the name has been changed to State Machine Diagram. The following are the basic notational elements that can be used to make up a diagram:
* Filled circle, pointing to the initial state.
* Hollow circle containing a smaller filled circle, indicating the final state (if any).
* Rounded rectangle, denoting a state. Top of the rectangle contains a name of the state. Can contain a horizontal line in the middle, below which the activities that are done in that state are indicated.
* Arrow, denoting transition. The name of the event (if any) causing this transition labels the arrow body. A guard expression may be added before a "/ " and enclosed in square-brackets ( eventName[guardExpression] ), denoting that this expression must be true for the transition to take place. If an action is performed during this transition, it is added to the label following a "/ " ( eventName[guardExpression]/ action ).
* Thick horizontal line with either x>1 lines entering and 1 line leaving or 1 line entering and x>1 lines leaving. These denote join/ fork, respectively." [State machine diagram. Wikipedia]
This example of UML state machine diagram symbols for the ConceptDraw PRO diagramming and vector drawing software is included in the ATM UML Diagrams solution from the Software Development area of ConceptDraw Solution Park.
UML state machine diagram symbols
 Event-driven Process Chain Diagrams
Event-driven Process Chain (EPC) Diagram is a type of flowchart widely used for modeling in business engineering and reengineering, business process improvement, and analysis. EPC method was developed within the Architecture of Integrated Information Systems (ARIS) framework.
- Url Diagram For Banking Management System
- ATM UML Diagrams | Data Flow Diagrams (DFD) | Business ...
- UML Use Case Diagram Example Social Networking Sites Project ...
- Website launch - Flowchart | UML activity diagram - Servlet ...
- ATM UML Diagrams | Data Flow Diagrams (DFD) | Computer ...
- UML activity diagram - Servlet container | Rapid UML | Diagramming ...
- UML activity diagram - Servlet container | UML Diagram Types ...
- UML Activity Diagram
- State Diagram Example - Online Store | UML interaction overview ...
- UML interaction overview diagram - Online shopping | Online ...
- UML interaction overview diagram - Online shopping | UML activity ...
- UML activity diagram - Cash withdrawal from ATM | UML activity ...
- Website launch - Flowchart | UML component diagram - Start server ...
- UML activity diagram - Servlet container | Rapid UML | Servlet ...
- Activity Diagram In Uml Example
- UML activity diagram - Payment process
- How to Save a Diagram as a Web Page in ConceptDraw PRO | UML ...
- UML activity diagram
- UML Diagram | State Diagram Example - Online Store | AWS ...