This example is based on the organizational chart from the Ohio State University website. [osu.edu/ vpsearch/ images/ University_ Org_ Chart.png]
"The Ohio State University, a multi-campus land grant institution with an international presence, is a world-class public research university and the leading comprehensive teaching and research institution in the state, Ohio's flagship university. Ohio State provides a distinctive educational experience for students and pursues cutting-edge interdisciplinary research that brings together scholars from diverse disciplines to solve key problems in society.
One of the University's core values is to "ignite a lifelong love of learning" in students. Ohio State students benefit from a scholarly environment in which research inspires and informs teaching.
The Vice President for Student Life provides vision, leadership, and strategic direction to the Office of Student Life, a comprehensive unit dedicated to supporting the educational mission of the University and promoting the best possible overall experience for the diverse student body of approximately 60,000. The Office of Student Life supports every aspect of Ohio State students experience. Its scope includes housing, campus dining, disability services, the multicultural center, counseling and health services, student organizations and leadership development, and other related operations." [osu.edu/ vpsearch/ ]
The organizational chart example "University leadership" was created using the ConceptDraw PRO diagramming and vector drawing software extended with the Organizational Charts solution from the Management area of ConceptDraw Solution Park.
Organizational chart - University leadership

Diagram Software - The Best Choice for Diagramming

 Organizational Charts
Organizational Charts solution extends ConceptDraw PRO software with samples, templates and library of vector stencils for drawing the org charts.
HelpDesk
How to Make a Workflow Diagram Using ConceptDraw PRO

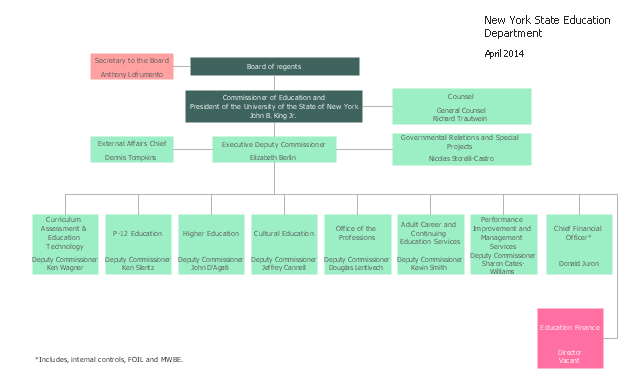
This organization chart sample was created on the base of the figure from the website of New York State Education Department (NYSED).
"The New York State Education Department is part of the University of the State of New York (USNY), one of the most complete, interconnected systems of educational services in the United States."
[oms.nysed.gov/ orgchart/ ]
The organizational chart example "New York State Education Department" was created using the ConceptDraw PRO diagramming and vector drawing software extended with the Organizational Charts solution from the Management area of ConceptDraw Solution Park.
Organizational chart
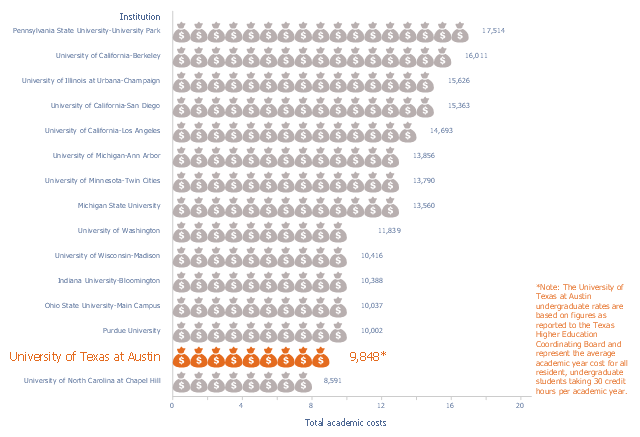
This picture bar graph sample shows the UT Austin Tuition Ranks 6th Compared to Other Texas Public Universities (Tuition and fees per semester, fall 2015). It was designed using data of the diagram "Compare UT Tuition" from the website of the University of Texas at Austin.
[tuition.utexas.edu/ compare]
The pictorial chart "Academic costs for residents, 2015-16" was created using the ConceptDraw PRO diagramming and vector drawing software extended with the Picture Graphs solution from the Graphs and Charts area of ConceptDraw Solution Park.
[tuition.utexas.edu/ compare]
The pictorial chart "Academic costs for residents, 2015-16" was created using the ConceptDraw PRO diagramming and vector drawing software extended with the Picture Graphs solution from the Graphs and Charts area of ConceptDraw Solution Park.
Pictorial chart
What Constitutes a Project?


- Example of Organizational Chart | Organizational chart - University ...
- Example Of A Grant Chart For Website Development
- University Organizational Chart Sample
- Diagram Of A University Chart
- Organizational chart - University leadership | Example of ...
- Draw A University Organisational Structure Of A University
- Organizational chart - University leadership | Example of ...
- How to Draw an Organization Chart | Organizational chart ...
- Network Architecture | Create Organizational Chart | Organizational ...
- Organisational Chart Of University In Nigeria
- Operations Org Chart
- Organizational Structure | How to Draw an Organization Chart ...
- Organizational chart - University leadership | Campus Area ...
- Organizational chart - University leadership
- Create Organizational Chart | Organizational Charts | Swot Analysis ...
- Organizational chart - University leadership | Local area network ...
- Competitor Analysis | Create Organizational Chart | Organizational ...
- Create Organizational Chart | Stanford University Library Organogram
- University Management Structure
- Create Organizational Chart | Draw Up An Organogram Of A University