HelpDesk
How to Use ConceptDraw Sales Dashboard Solution

 Quality Mind Map
This solution extends ConceptDraw MINDMAP software with Quality Management Mind Maps (Presentations, Meeting Agendas, Problem to be solved).
 Seven Management and Planning Tools
Seven Management and Planning Tools solution extends ConceptDraw DIAGRAM and ConceptDraw MINDMAP with features, templates, samples and libraries of vector stencils for drawing management mind maps and diagrams.
Example of DFD for Online Store (Data Flow Diagram)


HelpDesk
How to Create a Sales Dashboard

HelpDesk
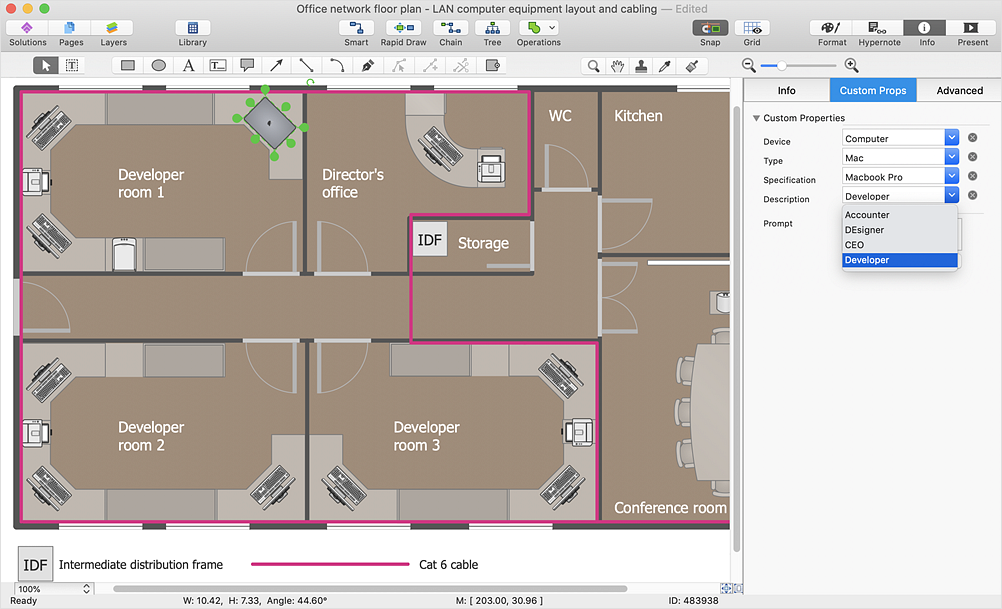
How to Work with Custom Properties
 Winter Sports
The Winter Sports solution from Sport area of ConceptDraw Solution Park contains winter sports illustration examples, templates and vector clipart libraries.
- Business and Finance | Holiday | UML Business Process | Post ...
- UML activity diagram - Ticket processing system | UML sequence ...
- UML activity diagram - Cash withdrawal from ATM | UML Activity ...
- Diagramming Software for Design UML Activity Diagrams | UML ...
- How to Create a Sales Flowchart Using ConceptDraw PRO | How ...
- UML sequence diagram - GET request
- Rapid UML | Diagramming Software for designing UML Sequence ...
- Types of Flowchart - Overview | Types of Flowcharts | Pyramid ...
- UML Package Diagram. Design Elements | Diagramming Software ...
- UML Activity Diagram | Diagramming Software for Design UML ...
- Diagramming Software for Design UML Activity Diagrams | UML ...
- Target and Circular Diagrams | HR Flowcharts | Holiday | Examples ...
- UML Activity Diagram. Design Elements
- Uml Activity Diagrams For C
- Process Flowchart | Types of Flowchart - Overview | Data Flow ...
- Rapid UML | Rapid UML | UML Class Diagram Tutorial | Use Case ...
- Credit Card Processing System UML Diagram
- UML Collaboration Diagram Example Illustration | Beauty in nature ...
- UML sequence diagram - Ticket processing system | Trouble ticket ...
- Process Flowchart | Business Process Diagram | Types of Flowchart ...