Cross-Functional Flowchart
Use of Cross-Functional Flowchart is a clear way of showing each team member’s responsibilities and how processes get shared or transferred between different responsible people, teams and departments. Use the best flowchart maker ConceptDraw DIAGRAM with a range of standardized cross-functional flowchart symbols to create the Cross-Functional Flowcharts simply and to visualize the relationship between a business process and the functional units responsible for that process. To draw the most quickly Cross-Functional Flowcharts, Cross Functional Process Maps, or Cross Functional Process Flow Diagrams, start with a Cross-functional flowchart samples and templates from ConceptDraw Solution Park. The ConceptDraw Arrows10 and RapidDraw technologies will be also useful for you in drawing. ConceptDraw DIAGRAM supports designing both types - horizontal and vertical Cross-functional flowcharts. A vertical layout makes the accents mainly on the functional units while a horizontal layout - on the process. If you need a Visio alternative in Mac OS X, try ConceptDraw DIAGRAM. Its interface is very intuitive and it’s actually much easier to use than Visio, yet somehow it’s just as powerful if not more so. ConceptDraw DIAGRAM performs professional quality work and seamless Visio interaction.
Data Flow Diagram Process
Data Flow Diagram (DFD) is a hierarchy of functional processes, connected by data flows. The purpose of this presentation is to show how each process converts its inputs into outputs and to identify relationships between these processes. DFD is convenient way of modeling and construction the information processes, it step-by-step illustrates the flow of information in a process. For construction a DFD traditionally are used two different notations, which appropriate to the methods of Yourdon-Coad and Gane-Sarson. These notations slightly different from each other by graphical representation of symbols for processes, data stores, data flow, external entities. When designing a DFD it is required to decompose the system into the components (sub-systems), for explaining a complex system you may need represent numerous levels. The Data Flow Diagrams solution from ConceptDraw Solution Park contains numerous predesigned DFD symbols for both notations, which help easy and effectively design professional-looking Data Flow Diagrams (DFDs) and DFD Process Diagrams.
 Area Charts
Area Charts are used to display the cumulative totals over time using numbers or percentages; or to show trends over time among related attributes. The Area Chart is effective when comparing two or more quantities. Each series of data is typically represented with a different color, the use of color transparency in an object’s transparency shows overlapped areas and smaller areas hidden behind larger areas.
 Logistics Flow Charts
Logistics Flow Charts solution extends ConceptDraw DIAGRAM functionality with opportunities of powerful logistics management software. It provides large collection of predesigned vector logistic symbols, pictograms, objects and clipart to help you design with pleasure Logistics flow chart, Logistics process flow diagram, Inventory flow chart, Warehouse flowchart, Warehouse management flow chart, Inventory control flowchart, or any other Logistics diagram. Use this solution for logistics planning, to reflect logistics activities and processes of an enterprise or firm, to depict the company's supply chains, to demonstrate the ways of enhancing the economic stability on the market, to realize logistics reforms and effective products' promotion.
 HR Flowcharts
Human resource management diagrams show recruitment models, the hiring process and human resource development of human resources.
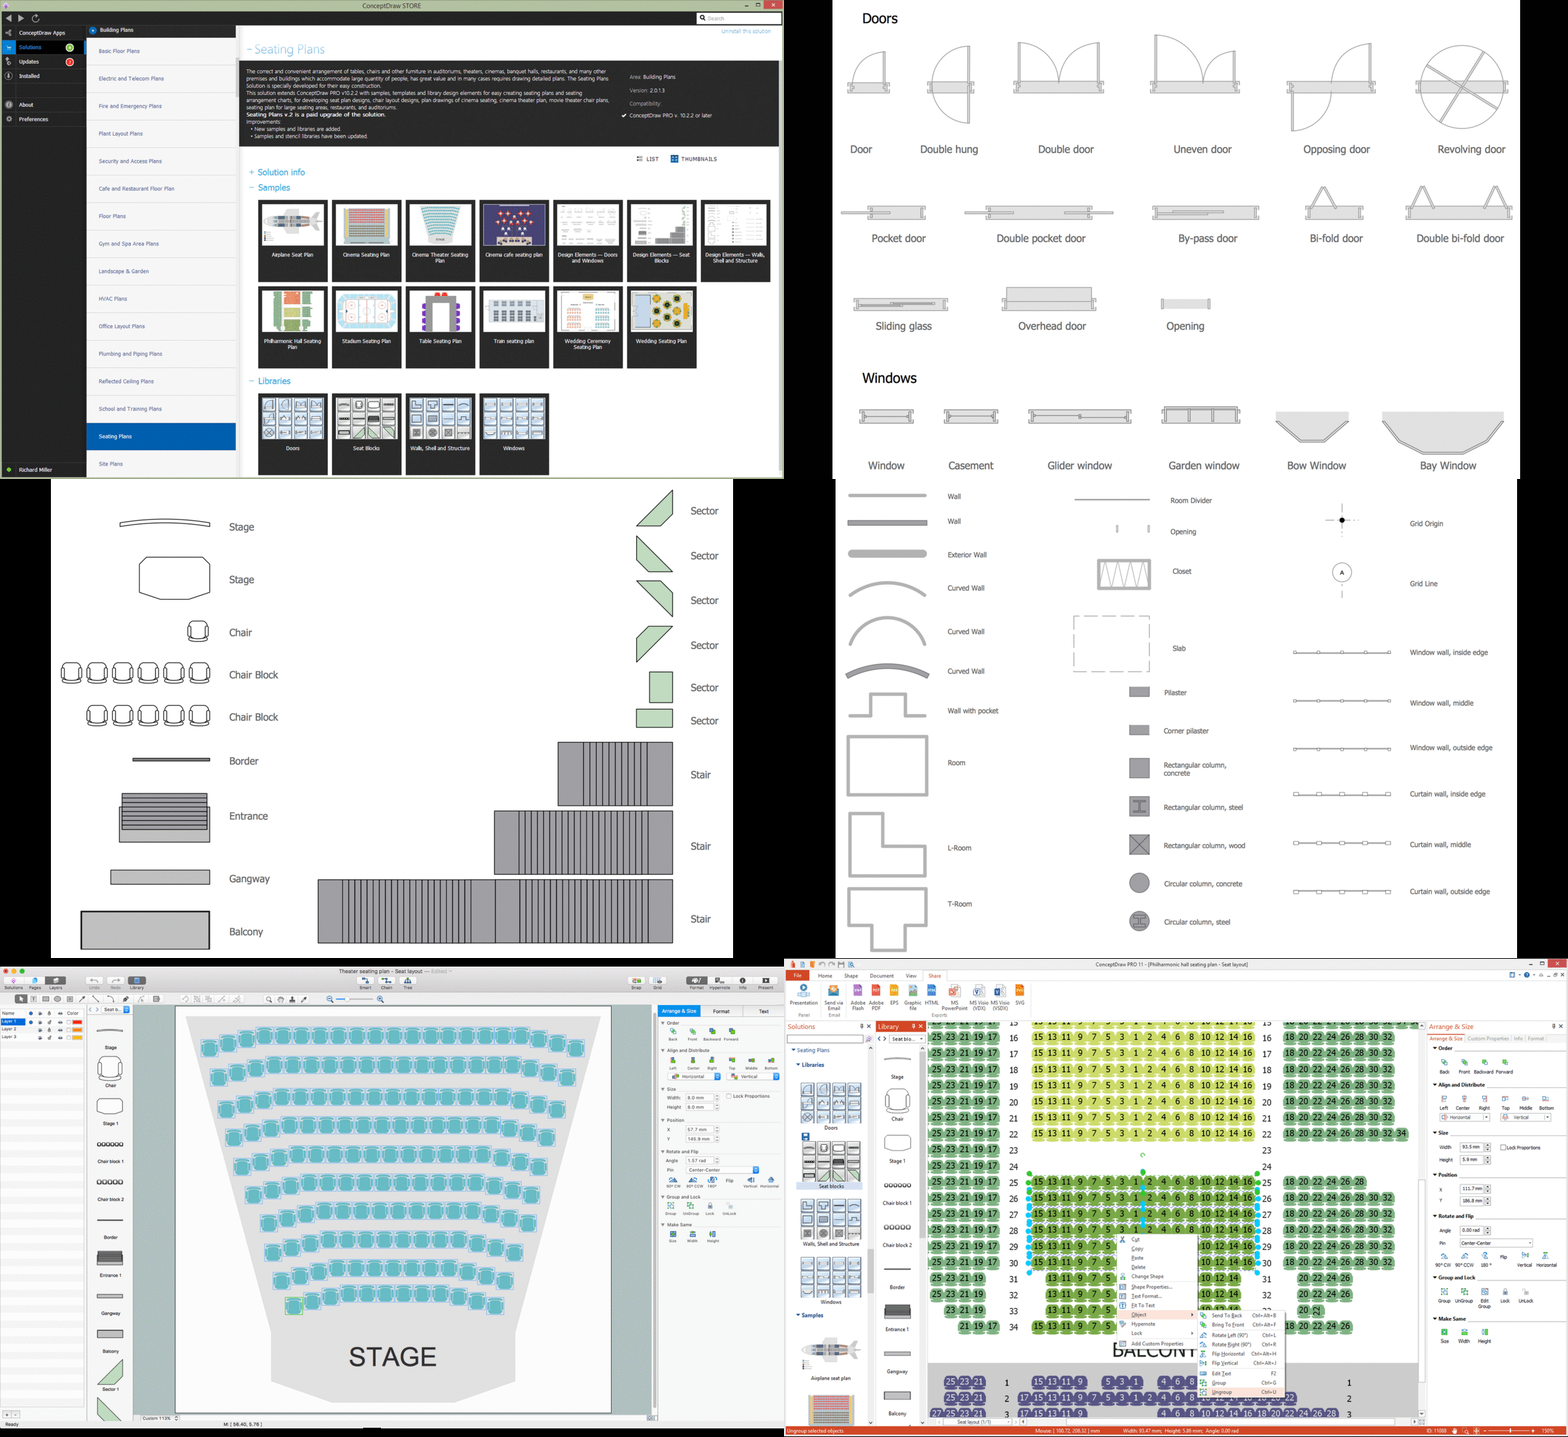
Building Drawing Software for Design Seating Plan
A Seating Plan is a scheme that illustrates the arrangement of seats on the plan of specific place. The seats can be located separately or grouped in rows like in stadiums. Usually they are numerated allowing spectators to choose them beforehand and have a guaranteed seat. It is especially useful for cinemas and theaters, where the places differ according to their price range. When all seatings are equal, it is used the open seating scheme and each client can choose any free seat. Each of these seating systems has many own advantages, it is also possible to mix them. Seating Plans, Schemes and Drawings are popular and widely used for purchase and sale the entering tickets to theatres, cinemas, stadiums, trains, airplanes, etc. They are also useful for beforehand planning and assignment the seats on weddings, banquets, and other events. ConceptDraw DIAGRAM enhanced with Seating Plans solution offers the helpful building drawing software tools for design Seating Plan using the predesigned templates and vector elements of doors, windows, walls, seats, etc.
- Activity Diagram For Admission Process
- Class Diagram For Admission System
- New Student Admission In A Colage Draw A Class Diagram Using
- Activity Diagram For Online Admission System
- Activity Diagram For Student Admission System
- Class Diagram For Student Admission System
- Class Diagram For Student Admission Process
- UML Use Case Diagram Example Registration System | Use Case ...
- Data Flow Diagram For Student Admission System
- Process Flowchart | UML Use Case Diagram Example Registration ...


