 Seven Basic Tools of Quality
Manage quality control in the workplace, using fishbone diagrams, flowcharts, Pareto charts and histograms, provided by the Seven Basic Tools of Quality solution.
"A root cause is an initiating cause of a causal chain which leads to an outcome or effect of interest. Commonly, root cause is used to describe the depth in the causal chain where an intervention could reasonably be implemented to change performance and prevent an undesirable outcome." [Root cause. Wikipedia]
"Problem-solving consists of using generic or ad hoc methods, in an orderly manner, for finding solutions to problems. Some of the problem-solving techniques developed and used in artificial intelligence, computer science, engineering, mathematics, medicine, etc. are related to mental problem-solving techniques studied in psychology." [Problem solving. Wikipedia]
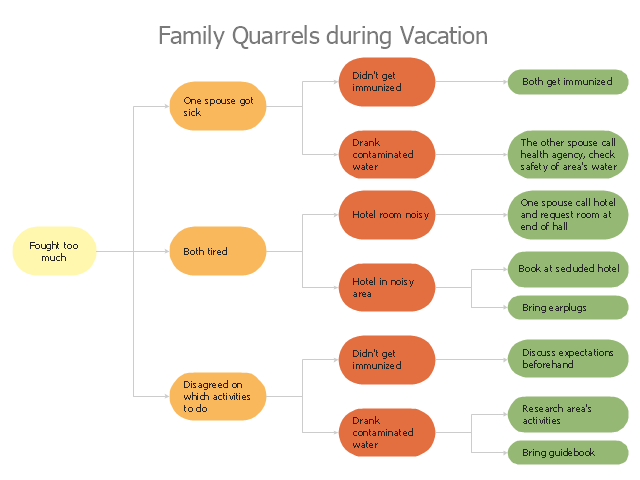
This root cause analysis (RCA) tree diagram example "Personal problem solution" was created using the ConceptDraw PRO diagramming and vector drawing software extended with the Seven Management and Planning Tools solution from the Management area of ConceptDraw Solution Park.
 Fishbone Diagrams
The Fishbone Diagrams solution extends ConceptDraw PRO v10 software with the ability to easily draw the Fishbone Diagrams (Ishikawa Diagrams) to clearly see the cause and effect analysis and also problem solving. The vector graphic diagrams produced using this solution can be used in whitepapers, presentations, datasheets, posters, and published technical material.
- Troubleshooting Decision Tree
- Troubleshooting Tree Template
- Troubleshooting Analysis Format
- Troubleshooting in Wireless Connection | Wireless Network ...
- Troubleshooting in Wireless Connection | Process Flowchart | Basic ...
- Decision Making | Influence Diagram | Fault Tree Diagram | Decision ...
- PROBLEM ANALYSIS. Root Cause Analysis Tree Diagram | Cause ...
- Process Flowchart | Decision Making | CORRECTIVE ACTIONS ...
- Step In Troubleshooting A System Using Block Diagram
- Troubleshooting in Wireless Connection | Use a Fishbone Diagram ...
- Troubleshooting Flowchart Examples
- Process Flowchart | Troubleshooting Tree
- Troubleshooting in Wireless Connection | Hotel Network Topology ...
- Root cause analysis tree diagram - Template | PROBLEM ...
- Root cause analysis tree diagram - Template | Cause and Effect ...
- Root Cause Tree Diagram Software
- Troubleshooting in Wireless Connection | Tree Network Topology ...
- Basic Flowchart Symbols and Meaning | Flowchart Software ...
- Problem Tree Analysis Ppt
