Sales KPI Dashboards

Export from ConceptDraw PRO Document to a Graphic File


 Spatial Dashboard
Spatial dashboard solution extends ConceptDraw PRO software with templates, samples and vector stencils libraries with thematic maps for drawing visual dashboards showing spatial data.
 Frequency Distribution Dashboard
Frequency distribution dashboard solution extends ConceptDraw PRO software with samples, templates and vector stencils libraries with histograms and area charts for drawing the visual dashboards showing frequency distribution of data.
 Status Dashboard
Status dashboard solution extends ConceptDraw PRO software with templates, samples and vector stencils libraries with graphic indicators for drawing the visual dashboards showing status data.
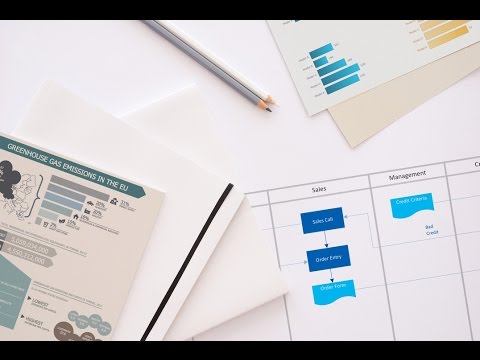
 Sales Dashboard
Sales Dashboard solution extends ConceptDraw PRO software with templates, samples and library of vector stencils for drawing the visual dashboards of sale metrics and key performance indicators (KPI).
 Comparison Dashboard
Comparison dashboard solution extends ConceptDraw PRO software with samples, templates and vector stencils library with charts and indicators for drawing the visual dashboard comparing data.
 Meter Dashboard
Meter dashboard solution extends ConceptDraw PRO software with templates, samples and vector stencils library with meter indicators for drawing visual dashboards showing quantitative data.
HelpDesk
How to Save a Drawing as a Graphic File in ConceptDraw PRO

 Composition Dashboard
Composition dashboard solution extends ConceptDraw PRO software with templates, samples and vector stencils library with charts and indicators for drawing visual dashboards showing data composition.
 Time Series Dashboard
Time series dashboard solution extends ConceptDraw PRO software with templates, samples and vector stencils libraries with charts, graphs and plots for drawing the visual dashboards showing data time series.
 ConceptDraw Dashboard for Facebook
ConceptDraw Dashboard for Facebook solution extends ConceptDraw PRO software with a dynamically updated visual dashboard, which shows lifetime total likes, daily friends of fans, and daily page views, information you can receive from Facebook Insights.
The vector stencils library "Sales dashboard" contains 27 charts and graphic indicators.
Use it for drawing sales dashboards in the ConceptDraw PRO diagramming and vector drawing software extended with the Sales Dashboard solution from the Marketing area of ConceptDraw Solution Park.
Use it for drawing sales dashboards in the ConceptDraw PRO diagramming and vector drawing software extended with the Sales Dashboard solution from the Marketing area of ConceptDraw Solution Park.
Column Chart

Bar Chart

Line Chart

Divided Bar

Pie Chart

Two Bubbles Indicator

Speedometer Gauge 1

Speedometer Gauge 2

Speedometer Gauge 3

Speedometer Gauge 4

Slider Horizontal 1

Slider Horizontal 2

Slider Horizontal 3

Slider Horizontal 4

Slider Horizontal 5

Slider Horizontal 6

Slider Horizontal 7

Slider Vertical 1

Slider Vertical 2

Slider Vertical 3

Bullet 1

Bullet 2

Bullet 3

Bullet 4

Backgroung 1

Backgroung 2

Backgroung 3

Balanced Scorecard Software

HelpDesk
How to Manage Multiple Projects on Mac

- Sales dashboard - Vector stencils library | Loading Bar Gif Transparent
- Process Flowchart | Sales dashboard - Vector stencils library ...
- Basic Flowchart Symbols and Meaning | Sales dashboard - Vector ...
- Design elements - People | Design elements - Garden paths and ...
- ConceptDraw Solution Park | Black Transparent Bar Png
- Europe Map Transparent
- Www Png Clipart Transparent Background
- Cashier Icon Transparent
- Loading Transparent Png
- Process Flowchart | Progress Bar Horizontal Transparent Gif
- Design elements - Transparent trees | Export from ConceptDraw ...
- Aws S3 Icon Transparent
- App icons - Vector stencils library | Imessage App Icon Transparent
- Design elements - Transparent trees | Design elements - Bushes ...
- Word Exchange | Open Book Clipart Transparent Background
- Basketball Court Transparent
- Vertical White Line Transparent Png
- Simple Tool To Make Transparent Png
- PM Dashboards | How to Create Project Dashboard on Mac | Project ...
- Vertical Firewall Image Transaparent