This example visual dashboard example shows website traffic metrics. Divided bar chart and pie chart are used to visualize compositional data. Scatter plot is used to visually analyse correlation between two data sets.
"Web traffic is the amount of data sent and received by visitors to a web site. ...
This is determined by the number of visitors and the number of pages they visit. Sites monitor the incoming and outgoing traffic to see which parts or pages of their site are popular and if there are any apparent trends, such as one specific page being viewed mostly by people in a particular country. There are many ways to monitor this traffic and the gathered data is used to help structure sites, highlight security problems or indicate a potential lack of bandwidth not all web traffic is welcome. Some companies offer advertising schemes that, in return for increased web traffic (visitors), pay for screen space on the site. Sites also often aim to increase their web traffic through inclusion on search engines and through search engine optimization." [Web traffic. Wikipedia]
The example "Website traffic dashboard" was created using the ConceptDraw PRO diagramming and vector drawing software extended with the Corellation Dashboard solution from the area "What is a Dashboard" of ConceptDraw Solution Park.
Visual dashboard

 CRM Center Dashboard
The CRM Center Dashboard solution extends ConceptDraw DIAGRAM functionality with CRM software tools, large collection of CRM Charts live objects, CRM icons, CRM indicators, CRM maps and navigation elements, the set of professionally designed CRM samples and templates to help you construct your own CRM Dashboards and CRM Center Dashboards in a few minutes, to depict the current and actual data by connecting or refreshing the data source file. The customer management software ConceptDraw DIAGRAM makes you free to choose the style for your dashboard and to regulate the quantity of clipart on the diagram according to your taste.
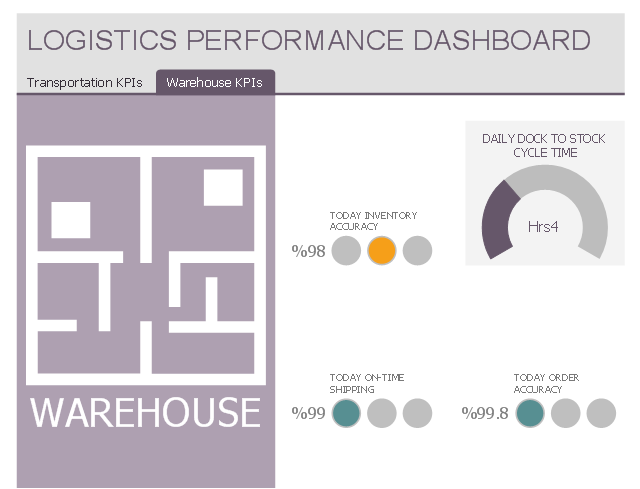
This multipage performance dashboard example shows navigation tab set and graphic indicators of logistic key performance indicators (KPIs) and business metrics.
"Dashboards often provide at-a-glance views of KPIs (key performance indicators) relevant to a particular objective or business process (e.g. sales, marketing, human resources, or production)." [Dashboard (business). Wikipedia]
The business dashboard example "Logistics Performance Dashboard" was designed using ConceptDraw PRO software extended with Logistic Dashboard solution from Business Processes area of ConceptDraw Solution Park.
Transportation KPIs
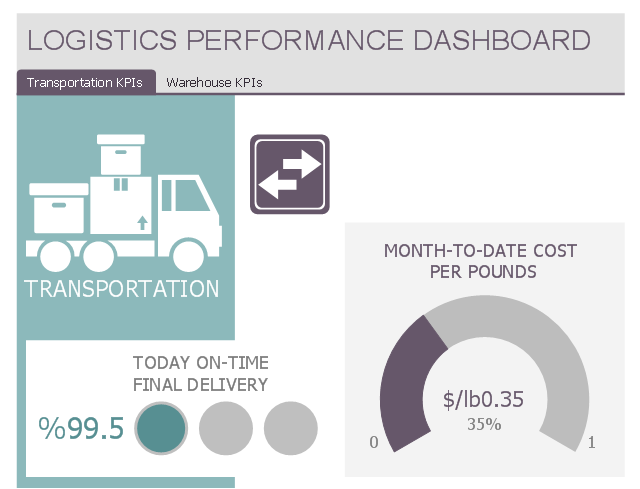
Warehouse KPIs
This multipage performance dashboard template contains navigation tab set and graphic indicators of logistic key performance indicators (KPIs) and business metrics.
Use it to create your logistic performance dashboard with ConceptDraw PRO software.
The business dashboard template "Logistics Performance Dashboard" is included in Logistic Dashboard solution from Business Processes area of ConceptDraw Solution Park.
Use it to create your logistic performance dashboard with ConceptDraw PRO software.
The business dashboard template "Logistics Performance Dashboard" is included in Logistic Dashboard solution from Business Processes area of ConceptDraw Solution Park.
Transportation KPIs
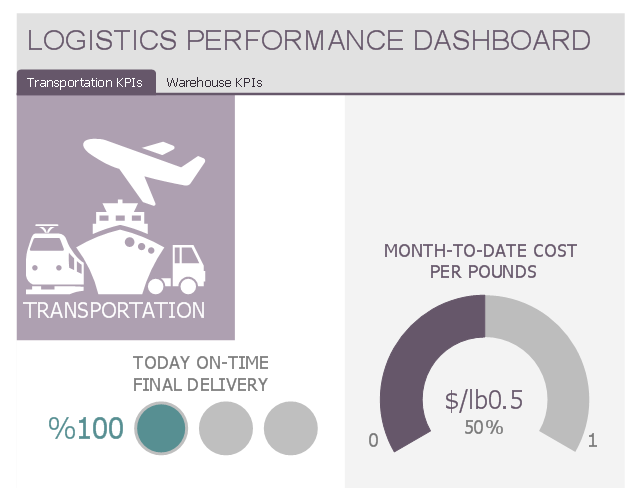
Warehouse KPIs

Dashboards. Time Scale. Part I
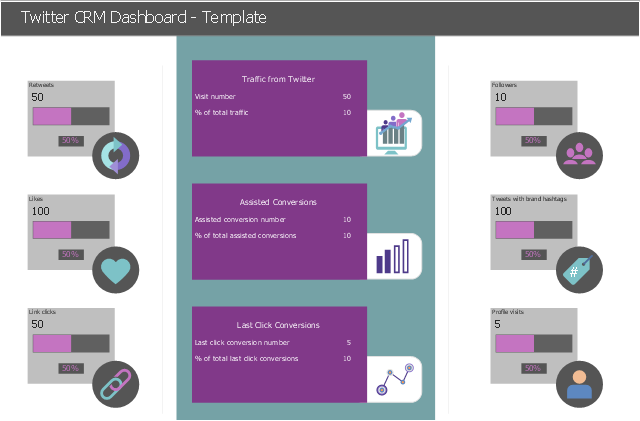
This social media customer service dashboard template uses graphic indicators (Level indicator and Multi digital values) to visualize Twitter CRM business metrics and KPIs: Retweets, Likes, Followers, Link clicks, Tweets with brand hashtags, Traffic from Twitter, Assisted Conversions, Last Click Conversions, Profile visits.
To set data source file for graphic indicator use Action menu.
Use this template to design your Twitter CRM dashboard with ConceptDraw PRO software.
The social CRM dashboard template "Twitter CRM Dashboard - Template" is included in CRM Center Dashboard solution from Management area of ConceptDraw Solution Park.
Business dashboard
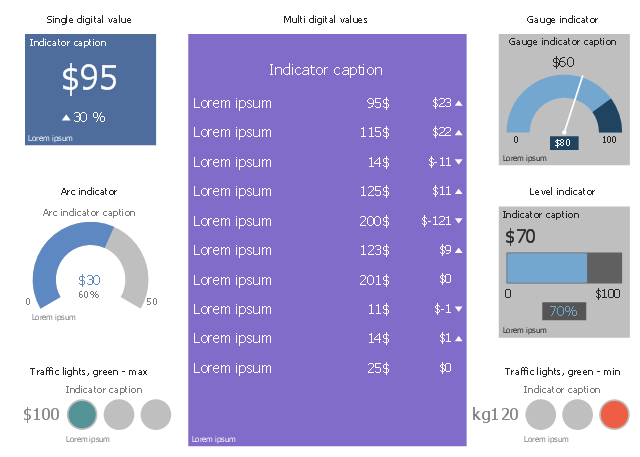
The vector stencils library "CRM indicators" contains 7 graphic indicators: single digital value indicator, multi digital value indicator, gauge, level indicator, traffic lights.
Use it to visualize business metrics and KPIs on your CRM center dashboards with ConceptDraw PRO software.
The graphic indicators example "Design elements - CRM indicators" is included in CRM Dashboard solution from Management area of ConceptDraw Solution Park.
Use it to visualize business metrics and KPIs on your CRM center dashboards with ConceptDraw PRO software.
The graphic indicators example "Design elements - CRM indicators" is included in CRM Dashboard solution from Management area of ConceptDraw Solution Park.
Dashboard stencils
 Status Dashboard
Status dashboard solution extends ConceptDraw DIAGRAM software with templates, samples and vector stencils libraries with graphic indicators for drawing the visual dashboards showing status data.
 Composition Dashboard
Composition dashboard solution extends ConceptDraw DIAGRAM software with templates, samples and vector stencils library with charts and indicators for drawing visual dashboards showing data composition.
This social media customer service dashboard template uses graphic indicators (Level indicator and Multi digital values) to visualize Twitter CRM business metrics and KPIs: Retweets, Likes, Followers, Link clicks, Tweets with brand hashtags, Traffic from Twitter, Assisted Conversions, Last Click Conversions, Profile visits.
To set data source file for graphic indicator use Action menu.
Use this template to design your Twitter CRM dashboard with ConceptDraw PRO software.
The social CRM dashboard template "Twitter CRM Dashboard - Template" is included in CRM Center Dashboard solution from Management area of ConceptDraw Solution Park.
To set data source file for graphic indicator use Action menu.
Use this template to design your Twitter CRM dashboard with ConceptDraw PRO software.
The social CRM dashboard template "Twitter CRM Dashboard - Template" is included in CRM Center Dashboard solution from Management area of ConceptDraw Solution Park.
Business dashboard
- Website metrics - Visual dashboard
- Website traffic dashboard | Website metrics - Visual dashboard ...
- Website traffic dashboard | Website KPIs - Visual dashboard ...
- Website traffic dashboard
- Data Dashboard Pie Chart
- Chart Examples | Website traffic dashboard | Chart Templates ...
- Status Dashboard | Road Transport - Design Elements | Aerospace ...
- Status Dashboard | Aerospace and Transport | Time Series ...
- Time Series Dashboard | How to Draw a Landscape Design Plan ...
- Cafe performance metrics vs. air temperature - Visual dashboard ...