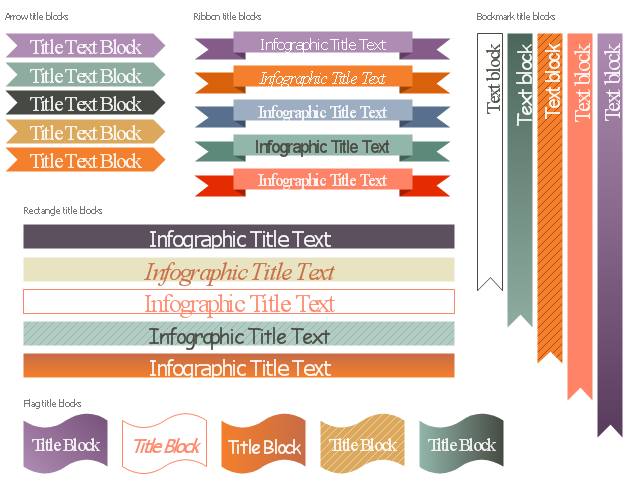
The vector stencils library "Title blocks" contains title and bookmark text blocks for creating marketing infograms.
"The title of a book, or any other published text or work of art, is a name for the work which is usually chosen by the author. A title can be used to identify the work, to place it in context, to convey a minimal summary of its contents, and to pique the reader's curiosity.
Some works supplement the title with a subtitle. Texts without separate titles may be referred to by their incipit, especially those produced before the practice of titling became popular. During development, a work may be referred to by a temporary working title. A piece of legislation may have both a short title and a long title. In library cataloging, a uniform title is assigned to a work whose title is ambiguous.In book design, the title is typically shown on the spine, the front cover, and the title page." [Title (publishing). Wikipedia]
The shapes example "Design elements - Title blocks" was created using the ConceptDraw PRO diagramming and vector drawing software extended with the Marketing Infographics solition from the area "Business Infographics" in ConceptDraw Solution Park.
Titles and bookmarks
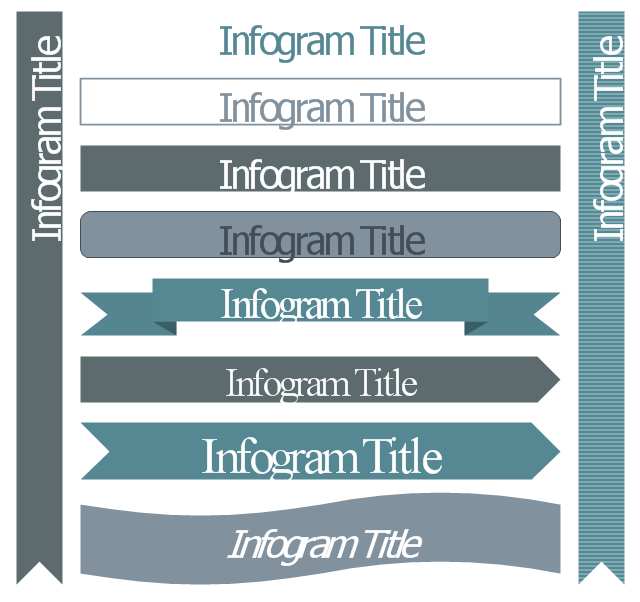
The vector stencils library "Management title blocks" contains 10 shapes: rectangle, rounded rectangle, ribbon, arrow, flag, bookmark.
Use it to design your management infogram.
The titles example "Design elements - Management title blocks" was created using the ConceptDraw PRO diagramming and vector drawing software extended with the Management Infographics solition from the area "Business Infographics" in ConceptDraw Solution Park.
Infographic titles
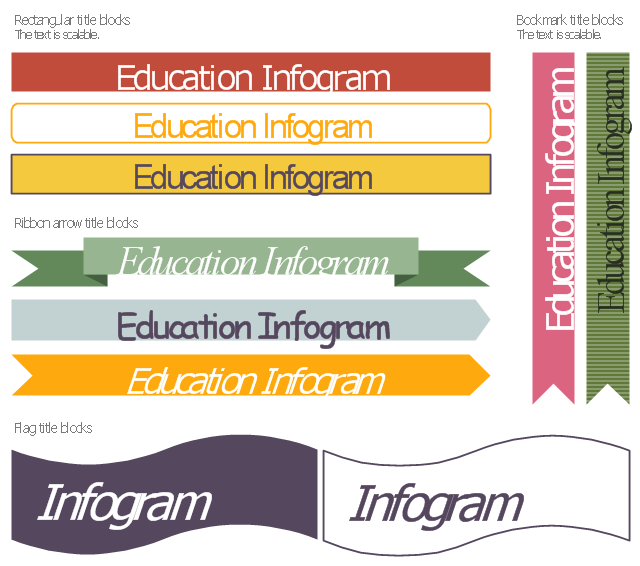
The vector stencils library "Education title blocks" contains 10 title block shapes: rectangular, arrow, ribbon, bookmark, flag.
Use these elements to design your educational infograms.
"The title of a book, or any other published text or work of art, is a name for the work which is usually chosen by the author. A title can be used to identify the work, to place it in context, to convey a minimal summary of its contents, and to pique the reader's curiosity." [Title (publishing). Wikipedia]
The shapes example "Design elements - Education title blocks" was created using the ConceptDraw PRO diagramming and vector drawing software extended with the Education Infographics solition from the area "Business Infographics" in ConceptDraw Solution Park.
Titles
Marketing Plan Infographic

This ecology infographic example was created on the base of the infographics "Greenhouse gas emissions in the EU" from the Debating Europe website. [debatingeurope.eu/ wp-content/ uploads/ 2013/ 06/ TH_ 2_ social.png]
"A greenhouse gas (sometimes abbreviated GHG) is a gas in an atmosphere that absorbs and emits radiation within the thermal infrared range. This process is the fundamental cause of the greenhouse effect. The primary greenhouse gases in the Earth's atmosphere are water vapor, carbon dioxide, methane, nitrous oxide, and ozone. Greenhouse gases greatly affect the temperature of the Earth; without them, Earth's surface would average about 33 °C colder, which is about 59 °F below the present average of 14 °C (57 °F)." [Greenhouse gas. Wikipedia]
The ecology infographic example "EU greenhouse gas emissions" was created using the ConceptDraw PRO diagramming and vector drawing software extended with the Management Infographics solition from the area "Business Infographics" in ConceptDraw Solution Park.
Ecology infographics example

Used Solutions
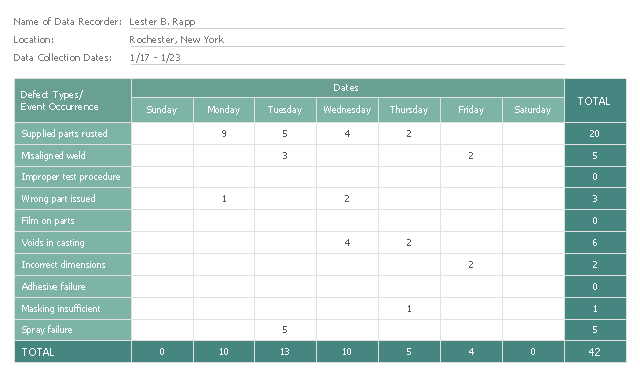
This check sheet example was redesigned from the Wikimedia Commons file: Check sheet for motor assembly.svg. [commons.wikimedia.org/ wiki/ File:Check_ sheet_ for_ motor_ assembly.svg]
This file is licensed under the Creative Commons Attribution-Share Alike 3.0 Unported license. [creativecommons.org/ licenses/ by-sa/ 3.0/ deed.en]
"The check sheet is a form (document) used to collect data in real time at the location where the data is generated. The data it captures can be quantitative or qualitative. When the information is quantitative, the check sheet is sometimes called a tally sheet.
The check sheet is one of the so-called Seven Basic Tools of Quality Control. ...
Kaoru Ishikawa identified five uses for check sheets in quality control:
- To check the shape of the probability distribution of a process
- To quantify defects by type
- To quantify defects by location
- To quantify defects by cause (machine, worker)
- To keep track of the completion of steps in a multistep procedure (in other words, as a checklist)" [. Wikipedia]
The example "Check sheet for motor assembly" was created using the ConceptDraw PRO software extended with the Seven Basic Tools of Quality solution from the Quality area of ConceptDraw Solution Park.
Check sheet example
Used Solutions
Quality
>
The healthcare management infographics example "Confirmed cases of swine flu in Australia" was redesigned from the Wikimedia Commons file: H1N1 Australia Confirmed Map.svg.
[commons.wikimedia.org/ wiki/ File:H1N1_ Australia_ Confirmed_ Map.svg]
"Swine influenza, also called pig influenza, swine flu, hog flu and pig flu, is an infection caused by any one of several types of swine influenza viruses. Swine influenza virus (SIV) or swine-origin influenza virus (S-OIV) is any strain of the influenza family of viruses that is endemic in pigs. As of 2009, the known SIV strains include influenza C and the subtypes of influenza A known as H1N1, H1N2, H2N1, H3N1, H3N2, and H2N3.
Swine influenza virus is common throughout pig populations worldwide. Transmission of the virus from pigs to humans is not common and does not always lead to human flu, often resulting only in the production of antibodies in the blood. If transmission does cause human flu, it is called zoonotic swine flu. People with regular exposure to pigs are at increased risk of swine flu infection.
Around the mid-20th century, identification of influenza subtypes became possible, allowing accurate diagnosis of transmission to humans. Since then, only 50 such transmissions have been confirmed. These strains of swine flu rarely pass from human to human. Symptoms of zoonotic swine flu in humans are similar to those of influenza and of influenza-like illness in general, namely chills, fever, sore throat, muscle pains, severe headache, coughing, weakness and general discomfort." [Swine influenza
From Wikipedia]
The thematic map example "Confirmed cases of swine flu in Australia" was created using the ConceptDraw PRO diagramming and vector drawing software extended with the Management Infographics solition from the area "Business Infographics" in ConceptDraw Solution Park.
Australia thematic map example

Education Infographics

The vector stencils library "Audit flowcharts" contains 31 symbols of audit flow chart diagrams for accounting, financial management, fiscal information tracking, money management, decision flowcharts, and financial inventories.
"A financial audit, or more accurately, an audit of financial statements, is the verification of the financial statements of a legal entity, with a view to express an audit opinion. The audit opinion is intended to provide reasonable assurance, but not absolute assurance, that the financial statements are presented fairly, in all material respects, and/ or give a true and fair view in accordance with the financial reporting framework. The purpose of an audit is to provide an objective independent examination of the financial statements, which increases the value and credibility of the financial statements produced by management, thus increase user confidence in the financial statement, reduce investor risk and consequently reduce the cost of capital of the preparer of the financial statements. ...
Financial audits are typically performed by firms of practicing accountants who are experts in financial reporting. The financial audit is one of many assurance functions provided by accounting firms. Many organizations separately employ or hire internal auditors, who do not attest to financial reports but focus mainly on the internal controls of the organization. External auditors may choose to place limited reliance on the work of internal auditors. Auditing promotes transparency and accuracy in the financial disclosures made by an organization, therefore would likely to reduce of such corporations to conceal unscrupulous dealings.
Internationally, the International Standards on Auditing (ISA) issued by the International Auditing and Assurance Standards Board (IAASB) is considered as the benchmark for audit process. Almost all jurisdictions require auditors to follow the ISA or a local variation of the ISA." [Financial audit. Wikipedia]
The example "Design elements - Audit flowchart" was created using the ConceptDraw PRO diagramming and vector drawing software extended with the Audit Flowcharts solution from the Finance and Accounting area of ConceptDraw Solution Park.
Audit flowchart symbols

Social Media Marketing Infographic

How to Make an Infographic

- Title Block Examples
- Design elements - Titles | Design elements - Title blocks | Design ...
- Design elements - Management title blocks | Design elements ...
- Design elements - Management title blocks | Marketing Plan ...
- Design elements - Title blocks
- Design elements - Title blocks | Design elements - Education title ...
- Title Block Sample
- Design elements - Title blocks | Design elements - Management title ...
- Design elements - Titles | Design elements - Text and Images ...
- Design elements - Titles | Design elements - Management title ...
- How to Draw a Landscape Design Plan | Design elements ...
- Callout Title Blocks
- Design elements - Tabbed text blocks | Design elements - Text ...
- Title Block Graphic Design
- Infographic Examples | How to Create Management Infographics ...
- ConceptDraw Solution Park | Rack Diagrams | Organizational ...
- Bio Flowchart Lite | Bio Flowchart | Content Marketing Infographics ...
- Flow Diagram Software | Flowchart Process Example | IDEF3 ...
- Box For Titles
- Block diagram - Six markets model | Functional Flow Block Diagram ...