HelpDesk
How to Create a Timeline Diagram in ConceptDraw PRO
A Timeline is a chart which displays a project plan schedule in chronological order. A Timeline is used in project management to depict project milestones and visualize project phases, and show project progress. The graphic form of a timeline makes it easy to understand critical project milestones, such as the progress of a project schedule. Timelines are particularly useful for project scheduling or project management when accompanied with a Gantt chart. It captures the main of what the project will accomplish and how it will be done. making a project timeline is one of the most important skills a project manager needs have. Making comprehensive, accurate timelines allows you getting every project off in the best way. ConceptDraw PRO allows you to draw a timeline charts using special library.HelpDesk
How to Change the Timescale in a Gantt Chart View
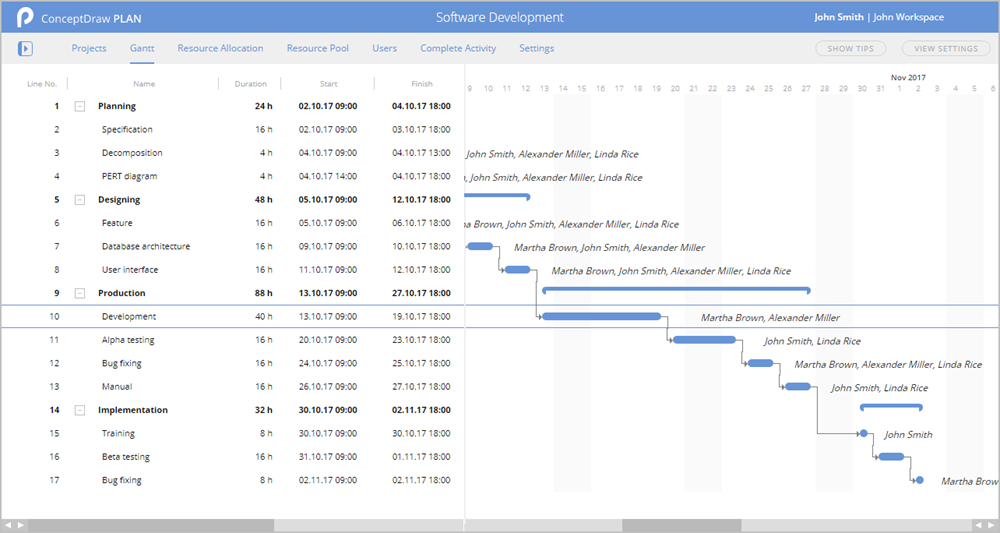
Most views in ConceptDraw PLAN have a timescale that shows the units of project time measurement (hour, day, week, etc.) used to schedule project tasks. You can change the timescale to view smaller or bigger time units, from hours all the way up to years. For example, you may want to show time in quarterы of the yearб or you may want to show Gantt chart across months and days.What is Gantt Chart (historical reference)
Historical reference about the Gantt chart.- How To Draw Time Scale Diagram
- Time Scale Diagram In Cpm
- Time Scale Logic Diagram Too Big
- Geologic Time Scale Chart
- Contoh Time Scale Diagram
- Time Scale Of Planning With Diagrams
- Marketing Time Scale
- The Process Of Drawing Time Scale
- Project Timeline | How to Create a Timeline Diagram in ...
- Activity Network Diagram Method | Program Evaluation and Review ...
- How To Draw Time Scale Graph In Project Management
- How to Create a Timeline Diagram in ConceptDraw PRO | Project ...
- Example Of Construction Project Planning Time Scale
- Timeline Diagrams | How to Create a Timeline Diagram in ...
- How to Make a Timeline | How to Create a Timeline Diagram in ...
- Draw Time Scale
- Project Timeline | How to Make a Timeline | Timeline Diagrams ...
- Schedule pie chart - Daily action plan | Pyramid Diagram | Gant ...
- Timeline Examples | Project Timeline | How to Make a Timeline ...


