Mechanical Drawing Symbols

The vector stencils library "Instruments" contains 72 symbols of control instruments and measuring devices: meters and gauges, and callouts, text boxes, and inserts.
Use these shapes to create annotated process flow diagrams (PFD), flow control, manufacturing processes, and distribution system diagrams in the ConceptDraw PRO software extended with the Chemical and Process Engineering solution from the Chemical and Process Engineering area of ConceptDraw Solution Park.
www.conceptdraw.com/ solution-park/ engineering-chemical-process
Indicator local

Indicator remote
Indicator auxiliary
CRT local

CRT remote
CRT auxiliary
PLC local

PLC auxiliary

PLC remote

Computer local

Computer auxiliary

Computer remote

Light local

Light remote
Light auxiliary
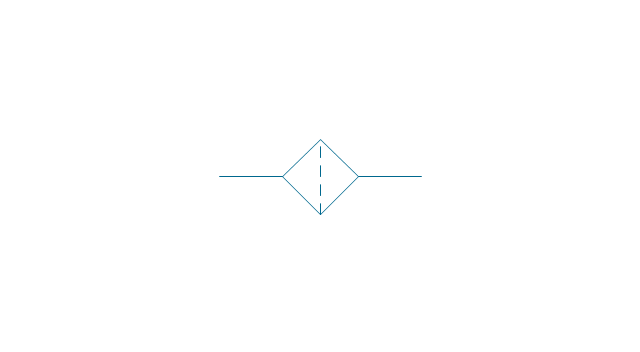
Indicator auxiliary (dashed)
-instruments---vector-stencils-library.png--diagram-flowchart-example.png)
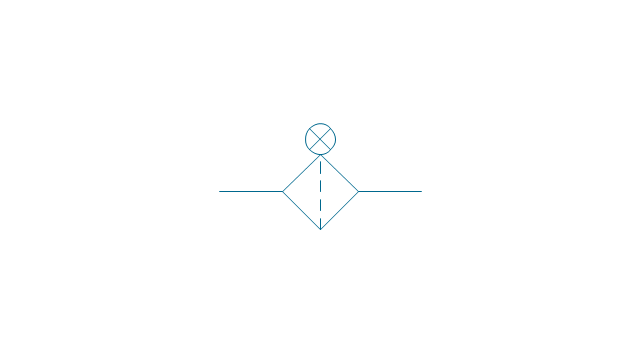
Indicator remote (dashed)
-instruments---vector-stencils-library.png--diagram-flowchart-example.png)
Steam traced auxiliary

Steam traced remote

Steam traced local

Level meter auxiliary
Level meter remote
Level meter local
Pressure gauge diaphragm
Pressure gauge

Pressure gauge liquid filled
Strain gauge
Thermometer bi-metallic

Thermometer gas

Thermometer general

Thermometer glass

Thermometer liquid
Thermometer resistance
Thermometer thermocouple
Flowmeter electromagnetic
Flowmeter general

Flowmeter nozzle
Flowmeter orifice
Flowmeter positive displacement
Flowmeter turbine

Flowmeter variable area
Flowmeter Venturi

Level meter capacitive
Level meter conductive
Level meter displacer

Level meter float
Level meter general

Level meter sonic
Indicator analoque

Indicator digital
Indicator general

Recorder analoque
Recorder digital
Recorder general
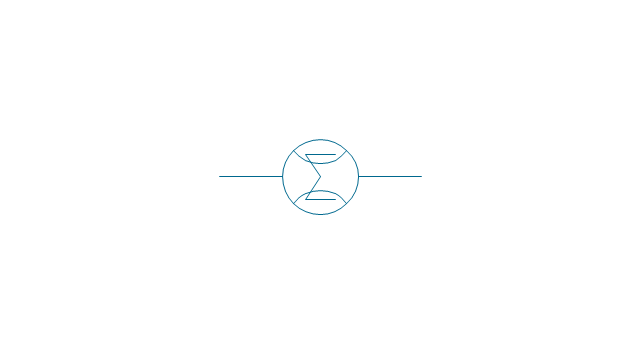
Converter
Converter 2 (1st half filled)
-instruments---vector-stencils-library.png--diagram-flowchart-example.png)
Converter 3 (2nd half filled)
-instruments---vector-stencils-library.png--diagram-flowchart-example.png)
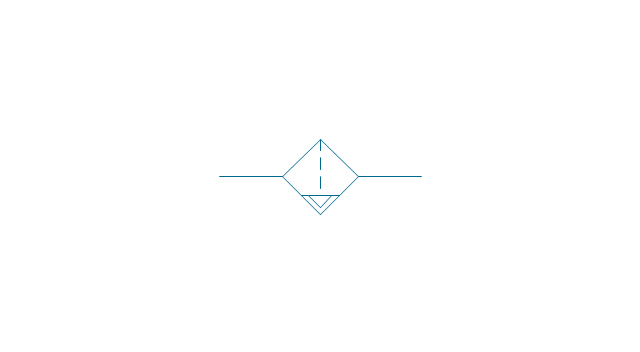
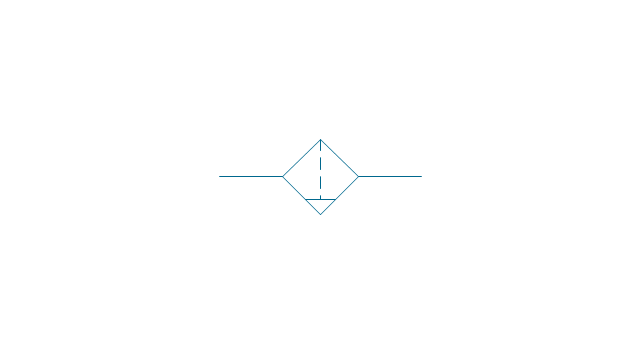
Venturi

Venturi (pressure taps)
-instruments---vector-stencils-library.png--diagram-flowchart-example.png)
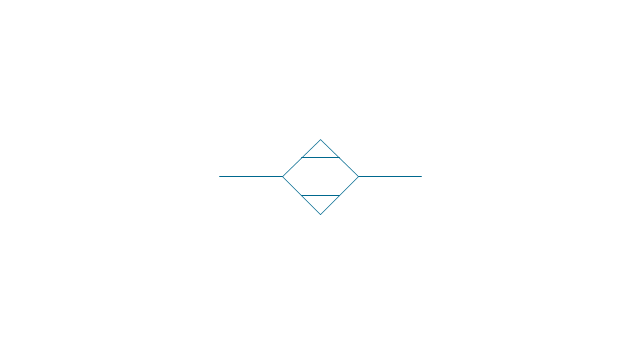
Flowmeter

Rotameter
Vortex sensor

Propeller meter
Generic utility

Operator box

Operator box 2 (1st half filled)
-instruments---vector-stencils-library.png--diagram-flowchart-example.png)
Operator box 3 (2nd half filled)
-instruments---vector-stencils-library.png--diagram-flowchart-example.png)
AND gate

OR gate

NOT gate

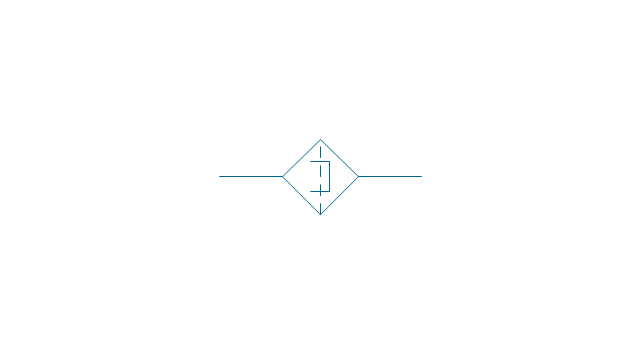
Correcting element

Diamond

The vector stencils library "Fluid power equipment" contains 113 symbols of hydraulic and pneumatic equipment including pumps, motors, air compressors, cylinders, meters, gauges, and actuators.
Use it to design fluid power and hydraulic control systems in the ConceptDraw PRO diagramming and vector drawing software extended with the Mechanical Engineering solution from the Engineering area of ConceptDraw Solution Park.
www.conceptdraw.com/ solution-park/ engineering-mechanical
Use it to design fluid power and hydraulic control systems in the ConceptDraw PRO diagramming and vector drawing software extended with the Mechanical Engineering solution from the Engineering area of ConceptDraw Solution Park.
www.conceptdraw.com/ solution-park/ engineering-mechanical
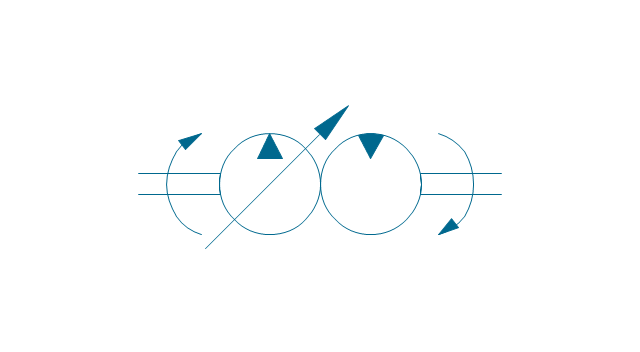
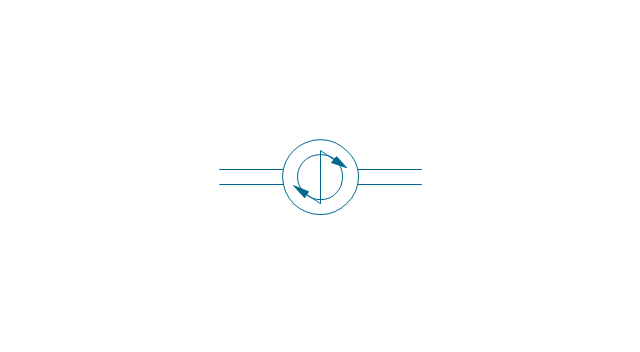
Actuator (semi-rotary), pneumatic
,-pneumatic-fluid-power-equipment---vector-stencils-library.png--diagram-flowchart-example.png)
Actuator (semi-rotary), hydraulic
,-hydraulic-fluid-power-equipment---vector-stencils-library.png--diagram-flowchart-example.png)
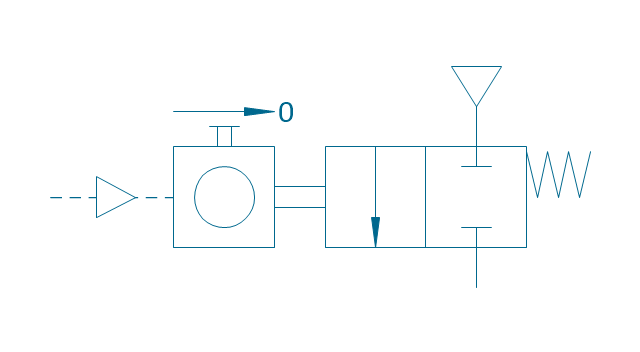
Drive unit, pneumatic
Drive unit, hydraulic
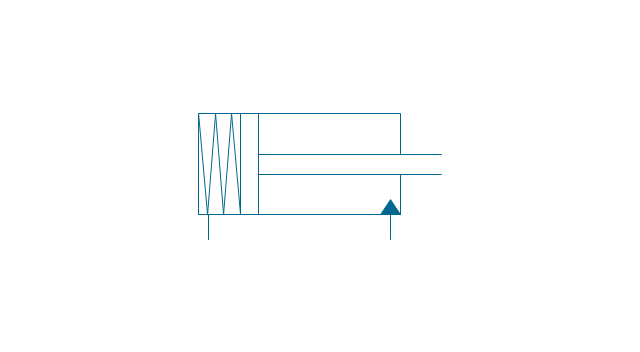
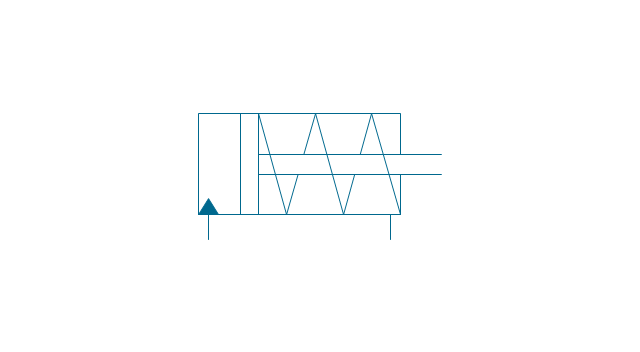
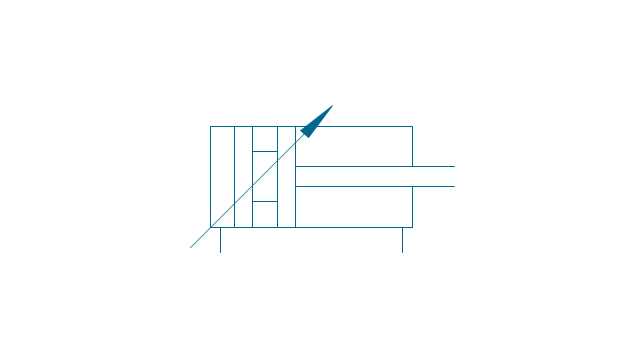
Sgl-act. cylinder, pneum., left spring
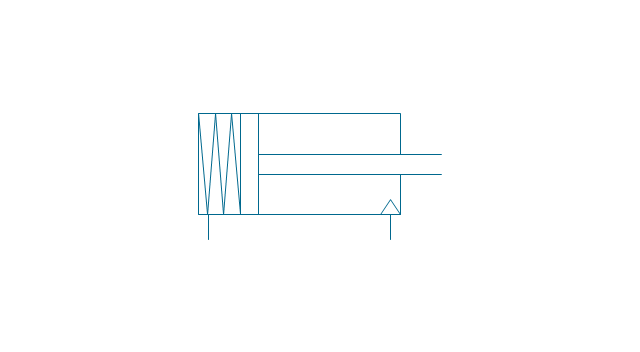
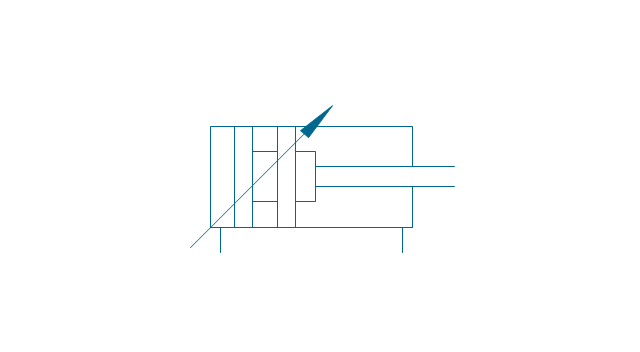
Sgl-act. cylinder, pneum., right spring
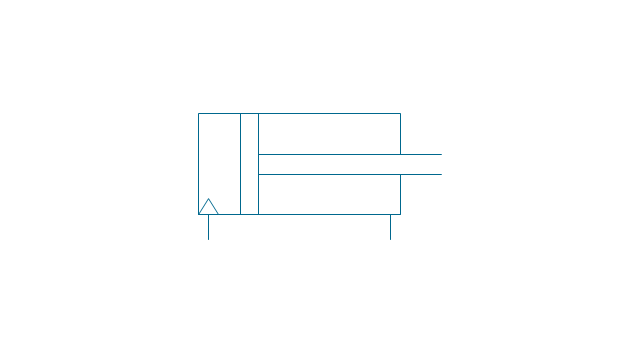
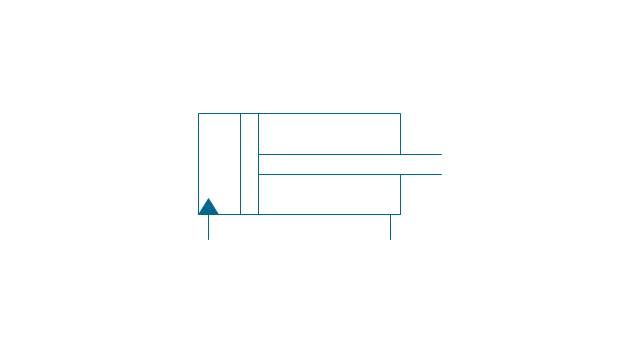
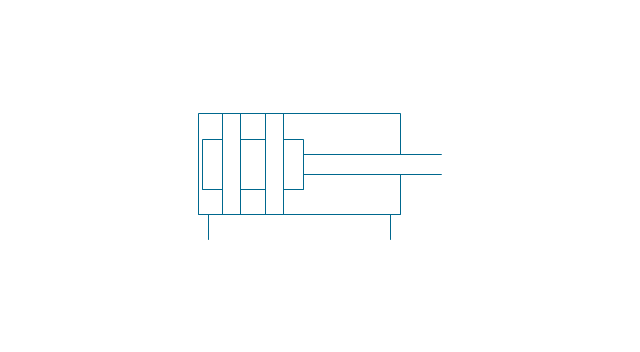
Sgl-act. cylinder, pneumatic
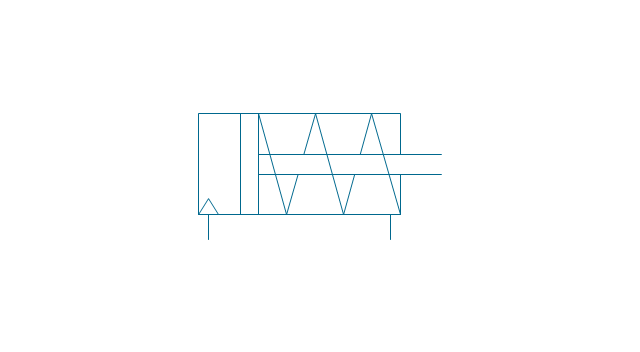
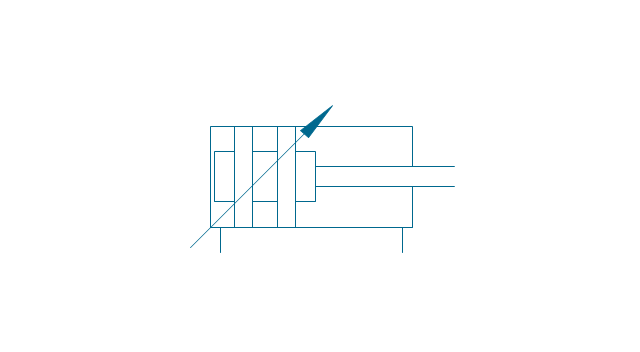
Sgl-act. cylinder, hydr., left spring
Sgl-act. cylinder, hydr., right spring
Sgl-act. cylinder, hydraulic
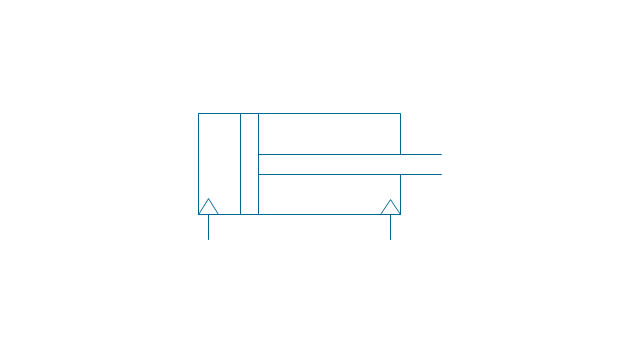
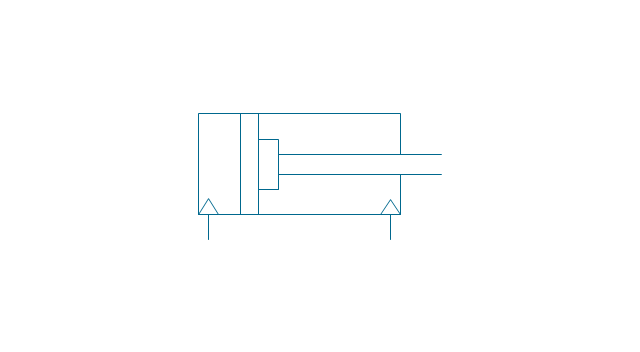
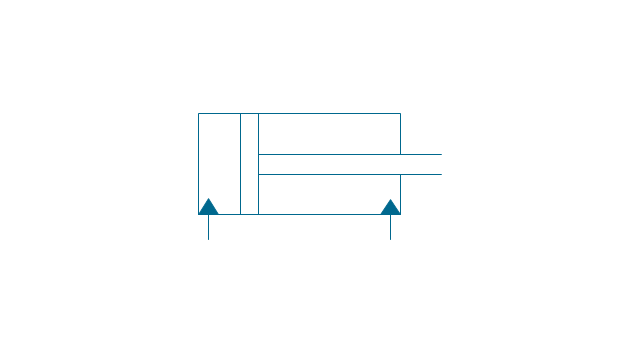
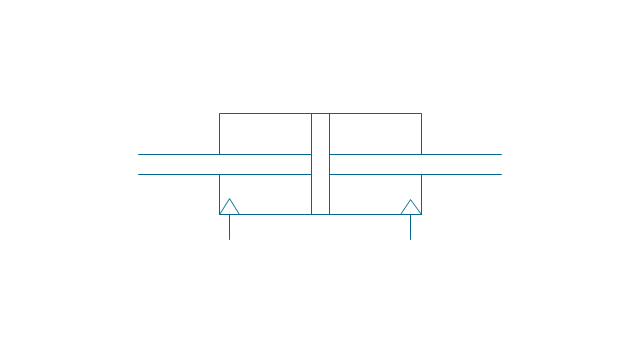
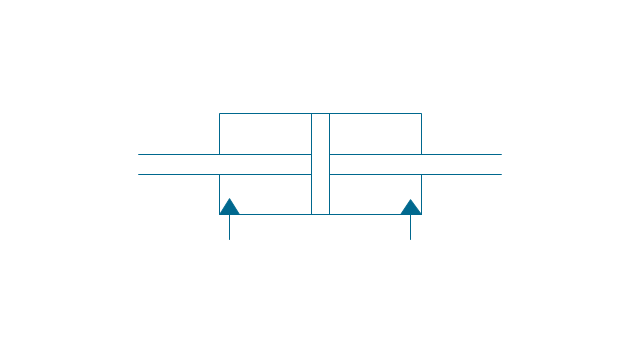
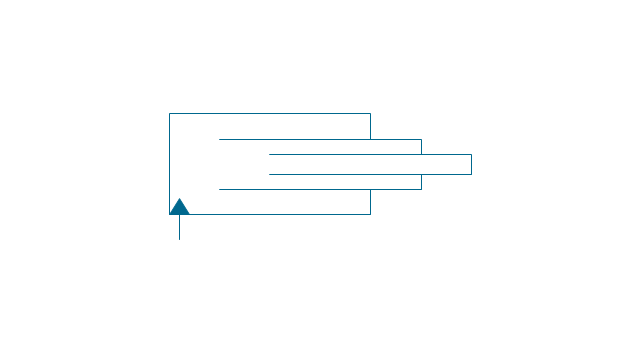
Dbl-act. cylinder, pneumatic
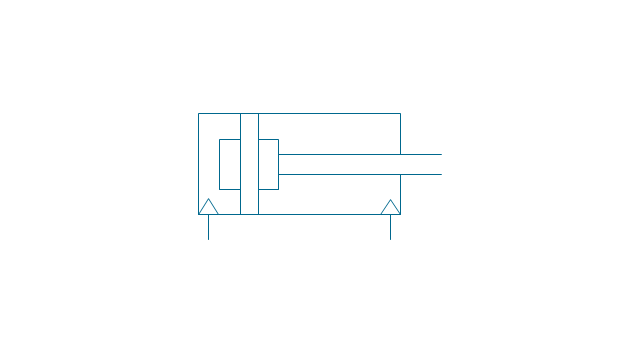
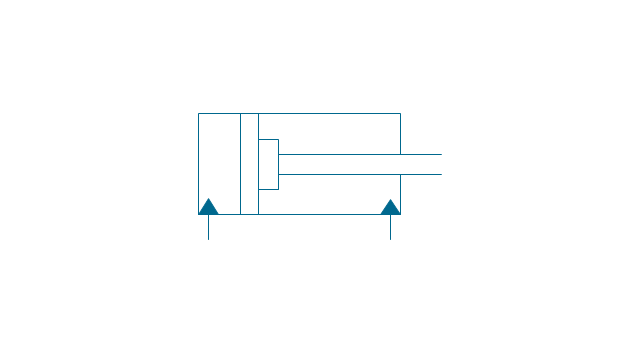
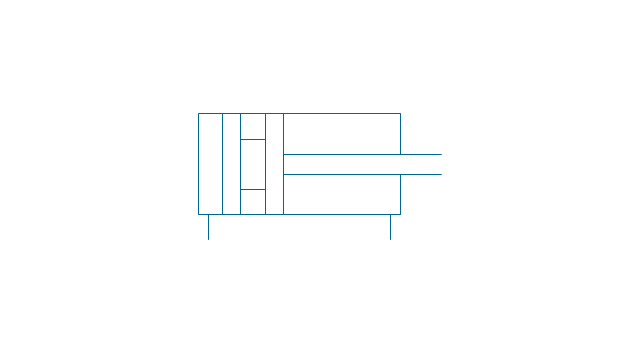
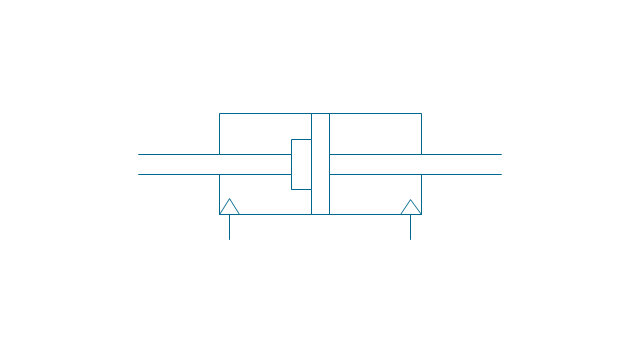
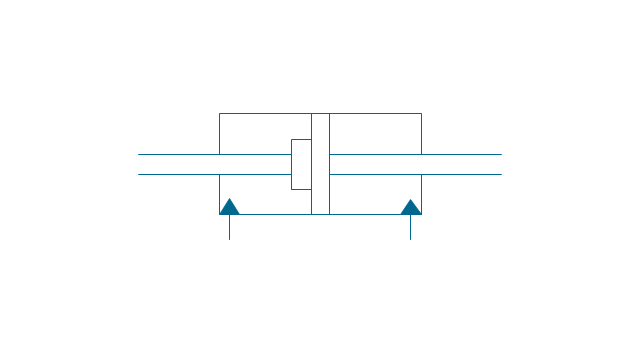
Dbl-act. cylinder, pneum., sgl cushion
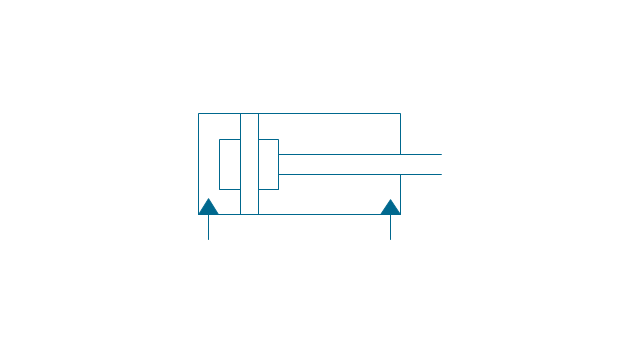
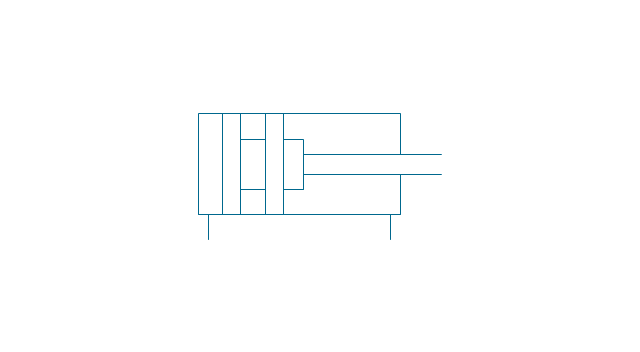
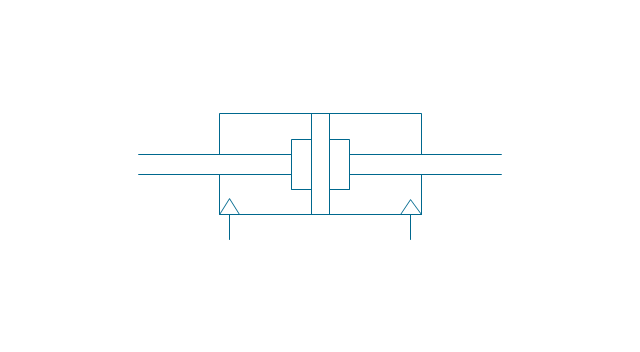
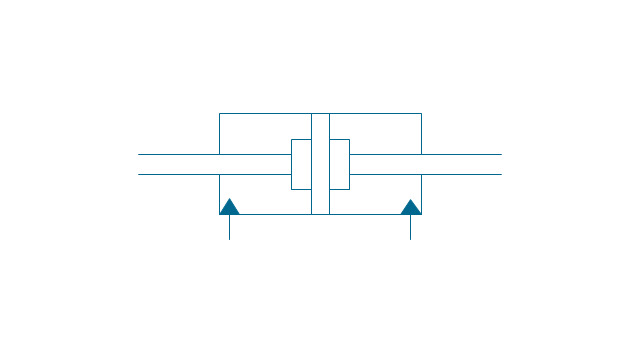
Dbl-act. cylinder, pneum., dbl cushion
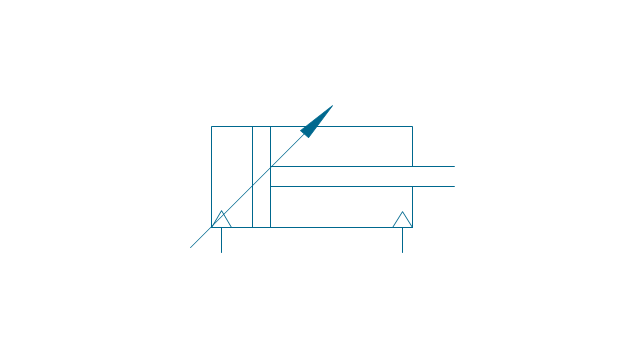
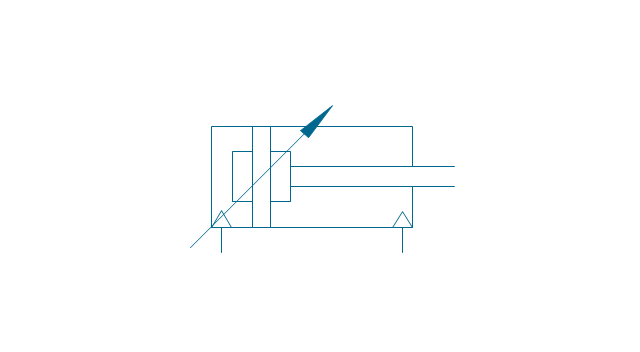
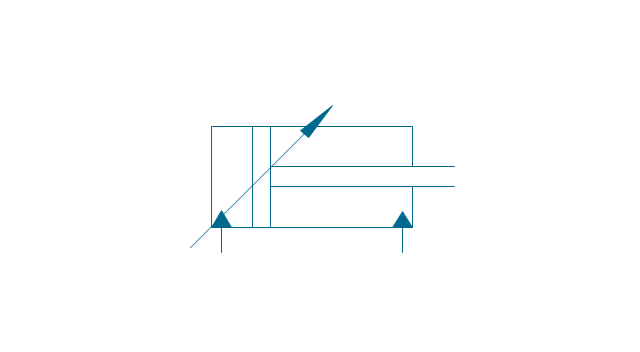
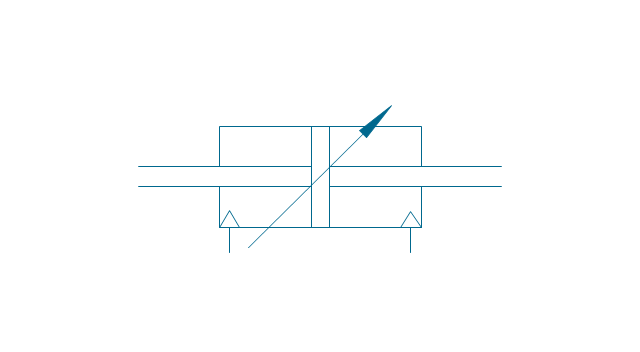
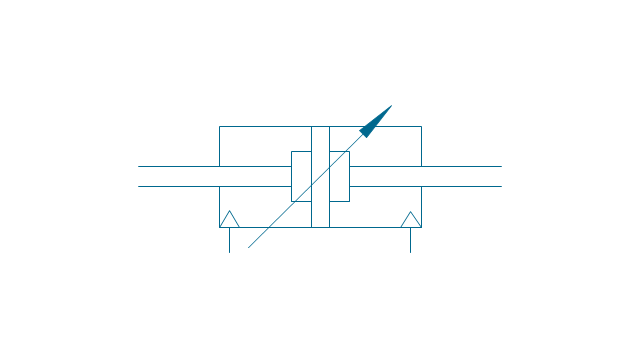
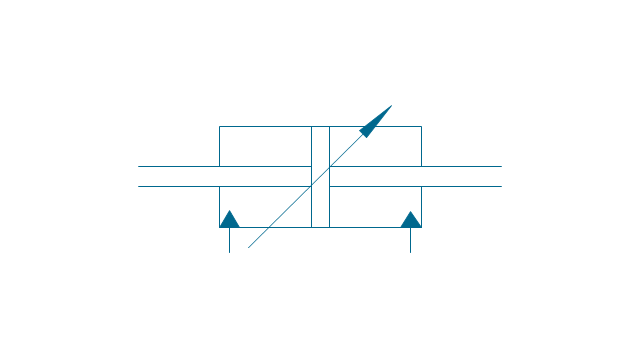
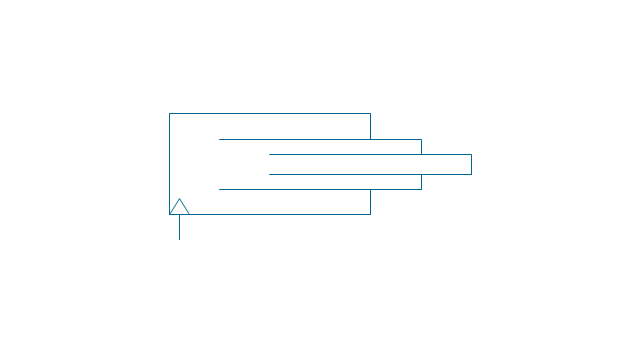
Dbl-act. cylinder, pneum., adjustable
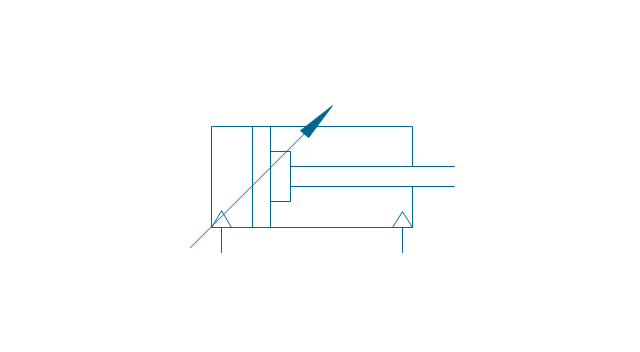
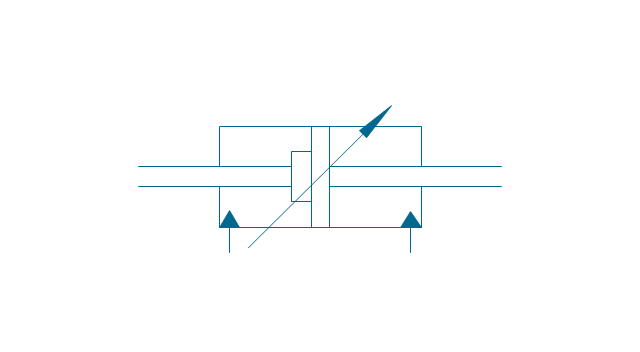
Dbl-act. cylinder, pneum., sgl cushion, adj.
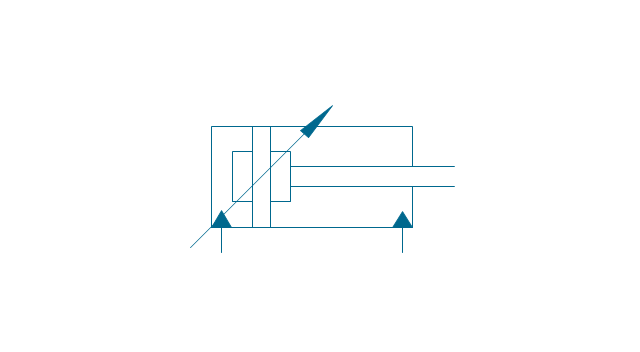
Dbl-act. cylinder, pneum., dbl cushion, adj.
Dbl-act. cylinder, hydraulic
Dbl-act. cylinder, hydr., sgl cushion
Dbl-act. cylinder, hydr., dbl cushion
Dbl-act. cylinder, hydr., adjustable
Dbl-act. cylinder, hydr., sgl cushion, adj.

Dbl-act. cylinder, hydr., dbl cushion, adj.
Dbl-act. cylinder, magnetic
Dbl-act. cylinder, magn., sgl cushion
Dbl-act. cylinder, magn., dbl cushion
Dbl-act. cylinder, magn., adjustable
Dbl-act. cylinder, magn., sgl cushion, adj.
Dbl-act. cylinder, magn., dbl cushion, adj.
Dbl-act. dbl-end. cylinder, pneumatic
Dbl-act. dbl-end. cylinder, pneum., sgl cushion
Dbl-act. dbl-end. cylinder, pneum., dbl cushion
Dbl-act. dbl-end. cylinder, pneum., adjustable
Dbl-act. dbl-end. cylinder, pneum., sgl cushion, adj.

Dbl-act. dbl-end. cylinder, pneum., dbl cushion, adj.
Dbl-act. dbl-end. cylinder, hydraulic
Dbl-act. dbl-end. cylinder, hydr., sgl cushion
Dbl-act. dbl-end. cylinder, hydr., dbl cushion
Dbl-act. dbl-end. cylinder, hydr., adjustable
Dbl-act. dbl-end. cylinder, hydr., sgl cushion, adj.
Dbl-act. dbl-end. cylinder, hydr., dbl cushion, adj.

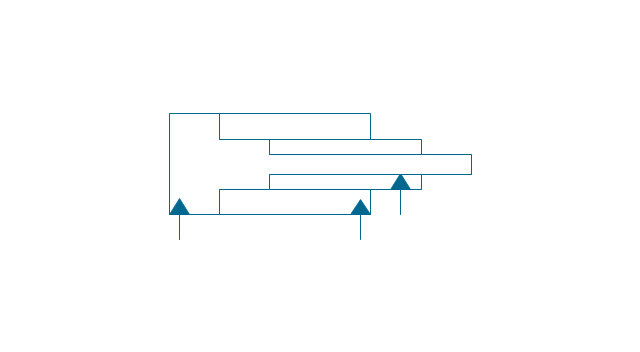
Telescopic cylinder, pneum., dbl-act.
Telescopic cylinder, hydr., dbl-act.
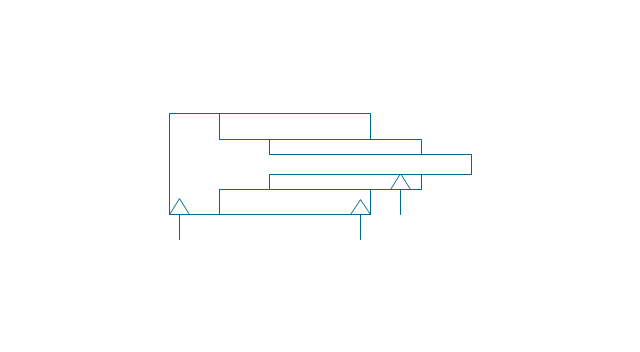
Telescopic cylinder, pneum., sgl-act.
Telescopic cylinder, hydr., sgl-act.
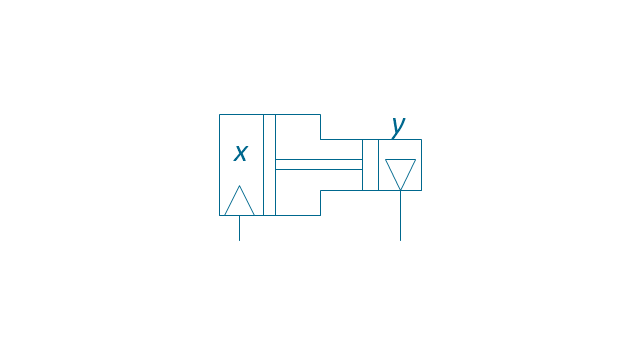
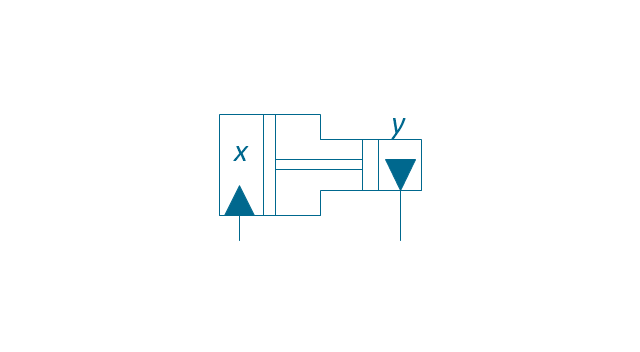
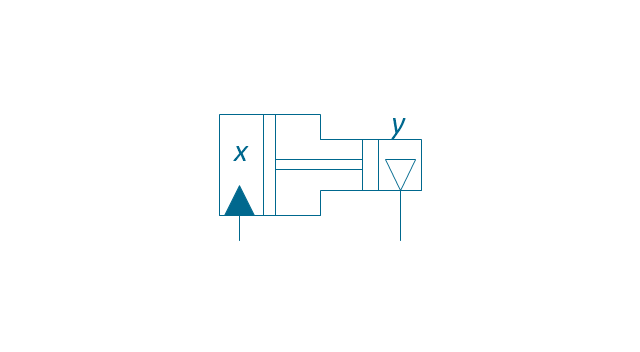
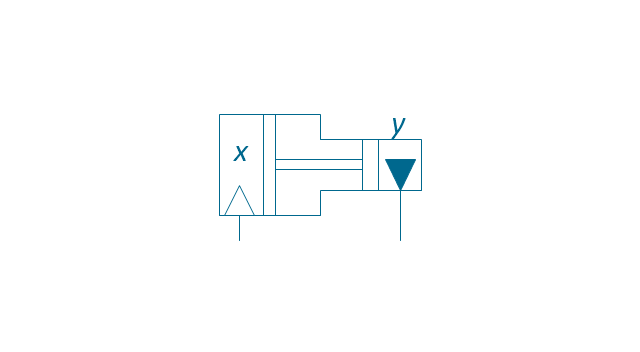
Actuator, hydraulic-pneumatic
Actuator, pneumatic-hydraulic
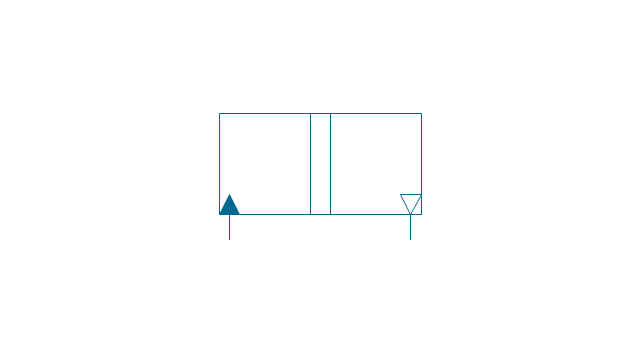
Intensifier, pneumatic
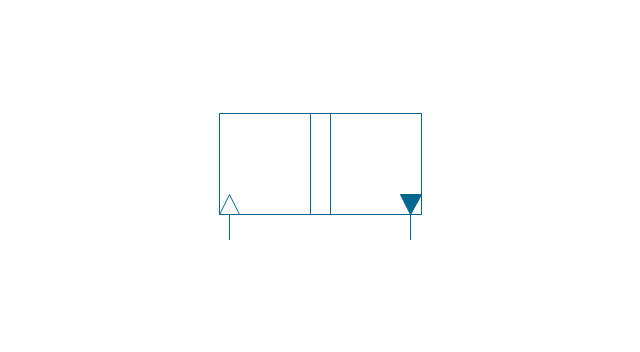
Intensifier, hydraulic
Intensifier, hydraulic-pneumatic
Intensifier, pneumatic-hydraulic
Intensifier, pneumatic-hydraulic
Intensifier, hydraulic-pneumatic

Actuator, pneumatic-hydraulic

Actuator, hydraulic-pneumatic
Accumulator
Accumulator, gas loaded
Accumulator, spring loaded
Accumulator, auxiliary gas bottle
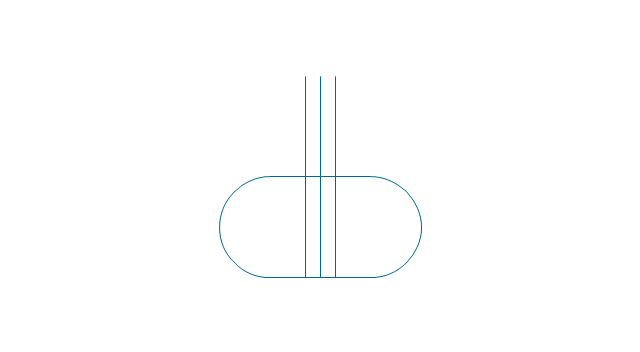
Air receiver

Energy source, pneumatic

Energy source, hydraulic

Energy source, electric motor
Energy source, non-electric prime mover
Vented reservoir
Sealed reservoir
Filter
Filter, magnetic element
Filter, contamination indicator
Automatic drain filter separator
Manual drain filter separator
Separator, automatic drain

Separator, manual drain

Air dryer
Lubricator
Air service unit, filter, separator
Air service unit, separator
Air service unit, filter
Air service unit
Liquid cooler
Gas cooler
Cooler
Liquid heater
Gas heater
Heater
Liquid temperature controller
Gas temperature controller
Temperature controller
Liquid temperature controller 2
Gas temperature controller 2
Temperature controller 2
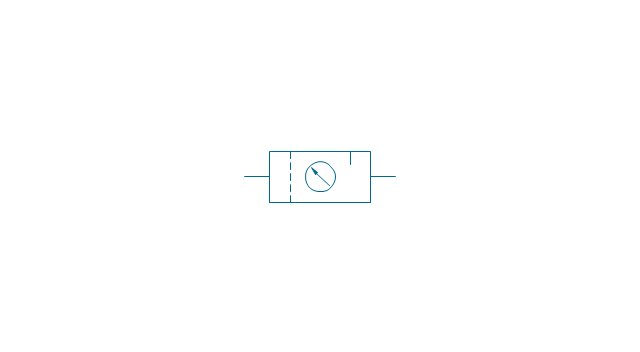
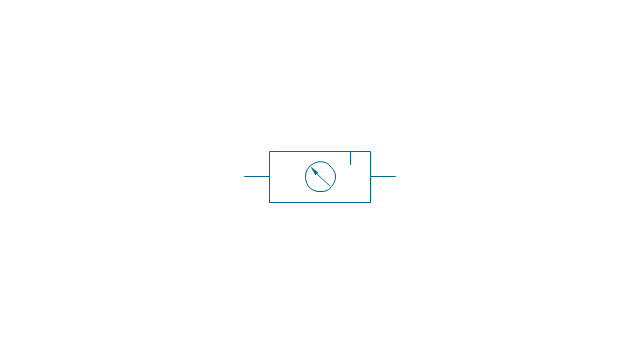
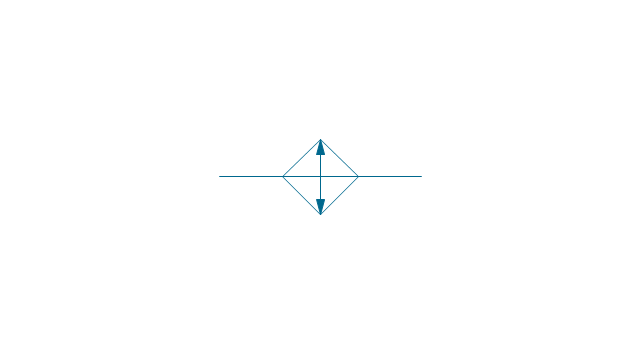
Pressure indicator

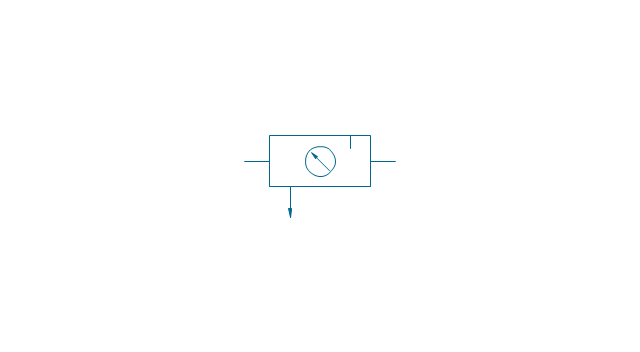
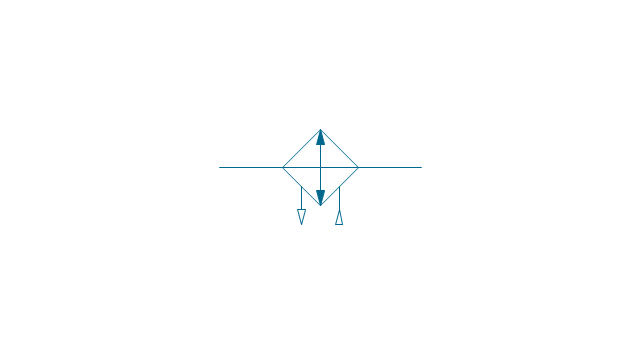
Pressure gauge

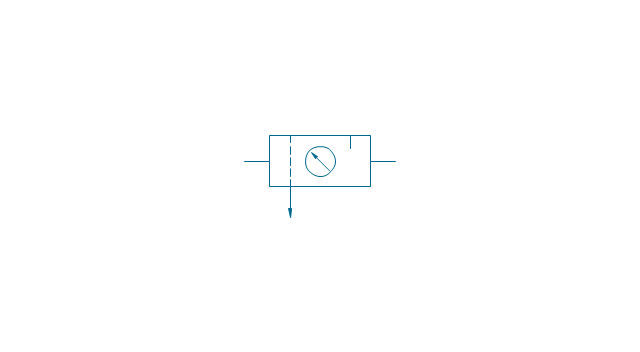
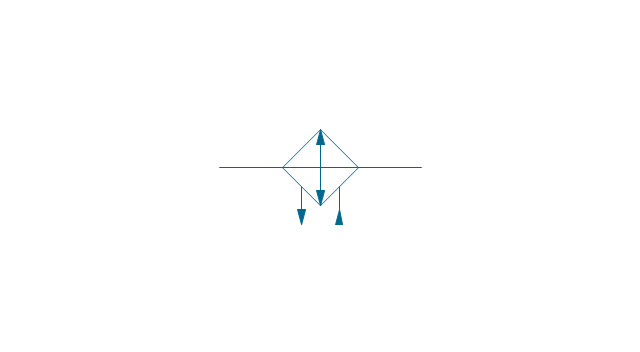
Differential pressure gauge

Thermometer

Liquid level measuring instrument
Flow indicator
Flow meter
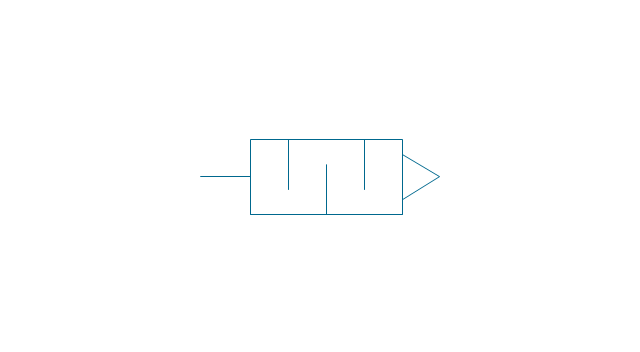
Integrating flow meter
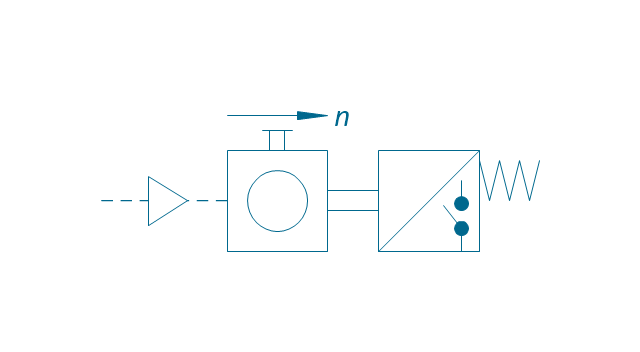
Tachometer

Torque measurement equipment
Pressure switch

Limit switch
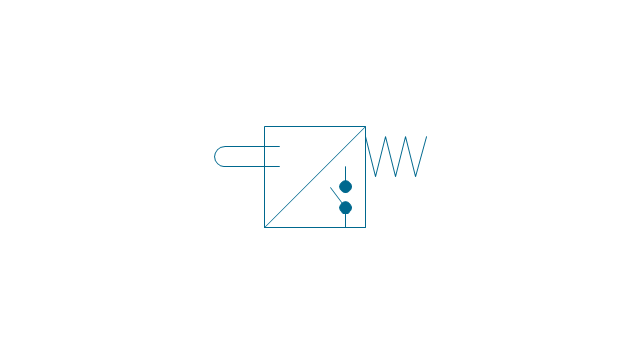
Transducer

Pulse counter
Pulse counter 2
Silencer
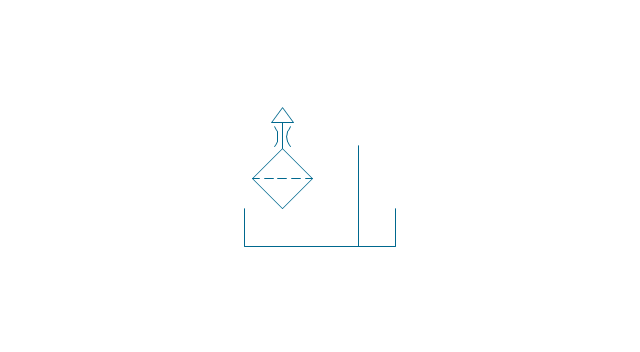
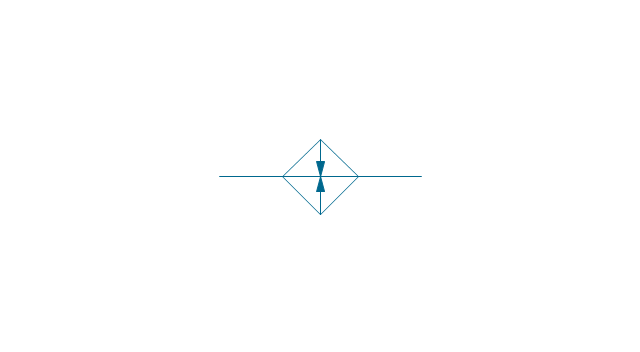
Drain (inlet below fluid, drain line)
-fluid-power-equipment---vector-stencils-library.png--diagram-flowchart-example.png)
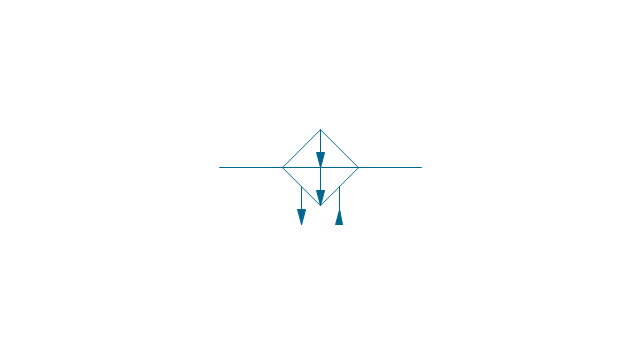
Drain (inlet below fluid, return line)
-fluid-power-equipment---vector-stencils-library.png--diagram-flowchart-example.png)
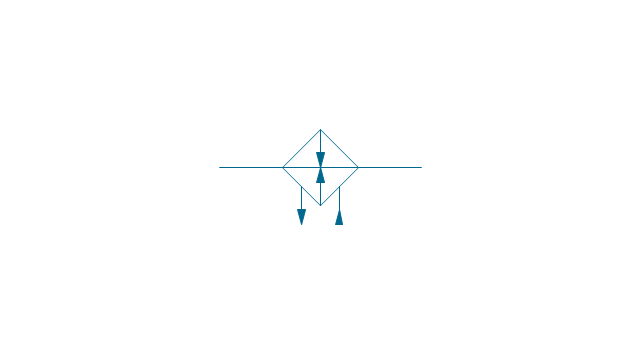
Drain (inlet above fluid, drain line)
-fluid-power-equipment---vector-stencils-library.png--diagram-flowchart-example.png)
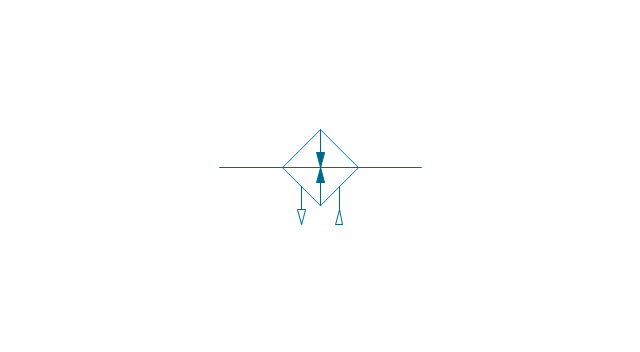
Drain (inlet above fluid, return line)
-fluid-power-equipment---vector-stencils-library.png--diagram-flowchart-example.png)
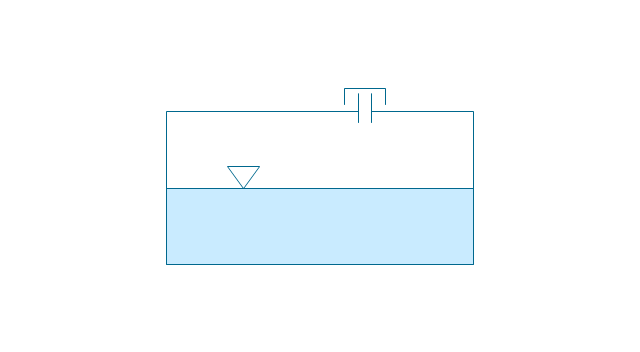
Oil tank
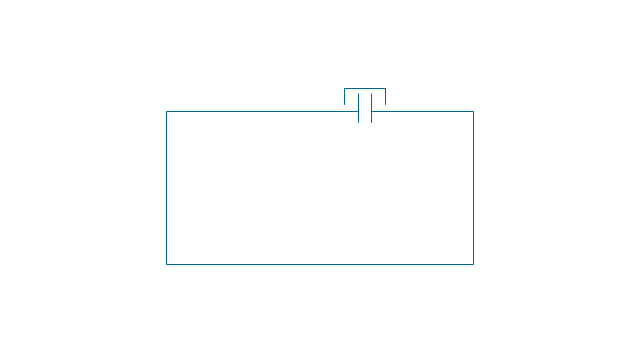
Oil tank, empty
Air compressor
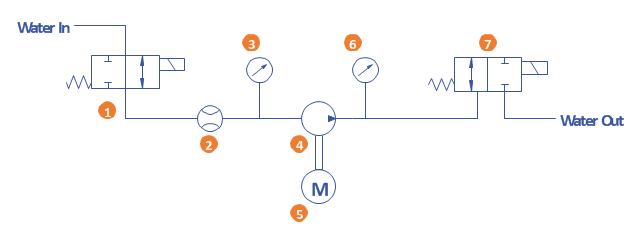
A simple hydraulic schematic showing apparatus for testing the strength of a hydraulic hose splice.
Water enters through normally closed solenoid valve (1) and passes through intake flow meter (2) to high pressure pump (4). Intake water pressure is monitored by pressure gauge (3). The hose to be tested connects between pump (4) and normally open solenoid activated drain valve (7). To test the hose, pump drive motor (5) is turned on, the solenoid of drain valve (7) is activated, closing the valve, and the pump is run to pressurize the hose. Test pressure is monitored by gauge (6). When the test is complete or the hose fails, the solenoid of drain valve (7) is deactivated, opening valve and discharging water, depressurizing the system. All components are operated electrically by a remote control circuit so that the operator may perform the test from a protected location, monitoring it with a camera and video monitor.
This hydraulic schematic example was redrawn using ConceptDraw PRO diagramming and vector drawing software from the Wikimedia Commons file: Hydraulic schematic.jpg.
[commons.wikimedia.org/ wiki/ File:Hydraulic_ schematic.jpg]
This file is licensed under the Creative Commons Attribution-Share Alike 3.0 Unported license.
[creativecommons.org/ licenses/ by-sa/ 3.0/ deed.en]
The hydraulic schematic example "Apparatus for testing the strength of a hydraulic hose splice" is included in the Mechanical Engineering solution from the Engineering area of ConceptDraw Solution Park.
Hydraulic system schematic
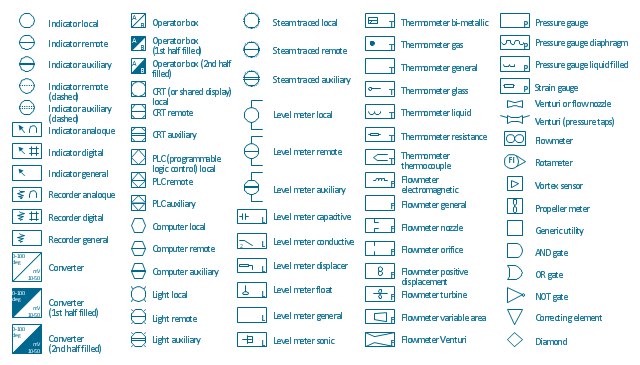
The vector stencils library "Instruments" contains 72 symbols of control instruments and measuring devices: meters and gauges, and callouts, text boxes, and inserts.
Use these shapes to create annotated process flow diagrams (PFD), flow control, manufacturing processes, and distribution system diagrams.
"Process control is an engineering discipline that deals with architectures, mechanisms and algorithms for maintaining the output of a specific process within a desired range.
Process control is extensively used in industry and enables mass production of continuous processes such as oil refining, paper manufacturing, chemicals, power plants and many other industries. Process control enables automation, with which a small staff of operating personnel can operate a complex process from a central control room." [Process control. Wikipedia]
The example "Design elements - Instruments" was created using the ConceptDraw PRO diagramming and vector drawing software extended with the Chemical and Process Engineering solution from the Engineering area of ConceptDraw Solution Park.
Process control instrument symbols
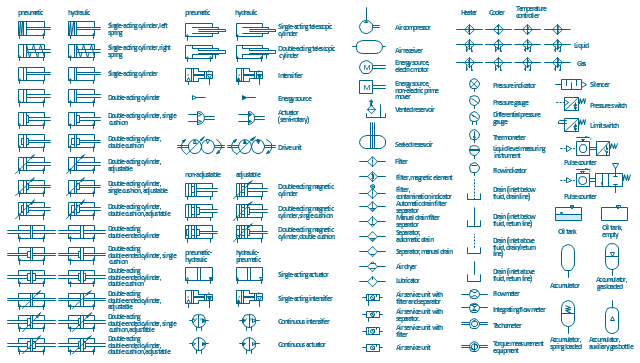
The vector stencils library "Fluid power equipment" contains 113 symbols of hydraulic and pneumatic equipment including pumps, motors, air compressors, cylinders, meters, gauges, and actuators. Use it to design fluid power and hydraulic control systems.
"Fluid power is the use of fluids under pressure to generate, control, and transmit power. Fluid power is subdivided into hydraulics using a liquid such as mineral oil or water, and pneumatics using a gas such as air or other gases. Compressed-air and water-pressure systems were once used to transmit power from a central source to industrial users over extended geographic areas; fluid power systems today are usually within a single building or mobile machine." [Fluid power. Wikipedia]
The shapes example "Design elements - Fluid power equipment" was created using the ConceptDraw PRO diagramming and vector drawing software extended with the Mechanical Engineering solution from the Engineering area of ConceptDraw Solution Park.
Fluid power symbols
The vector stencils library "Weather" contains 17 weather clipart images for drawing illustrations on climate to show cloudiness, air temperature, precipitation, wind.
"Weather is the state of the atmosphere, to the degree that it is hot or cold, wet or dry, calm or stormy, clear or cloudy. Most weather phenomena occur in the troposphere, just below the stratosphere. Weather generally refers to day-to-day temperature and precipitation activity, whereas climate is the term for the average atmospheric conditions over longer periods of time. When used without qualification, "weather", is generally understood to mean the weather of Earth.
Weather is driven by air pressure (temperature and moisture) differences between one place and another. These pressure and temperature differences can occur due to the sun angle at any particular spot, which varies by latitude from the tropics. The strong temperature contrast between polar and tropical air gives rise to the jet stream. Weather systems in the mid-latitudes, such as extratropical cyclones, are caused by instabilities of the jet stream flow. Because the Earth's axis is tilted relative to its orbital plane, sunlight is incident at different angles at different times of the year. On Earth's surface, temperatures usually range ±40°C (−40°F to 100°F) annually. Over thousands of years, changes in Earth's orbit affect the amount and distribution of solar energy received by the Earth and influence long-term climate and global climate change." [Weather. Wikipedia]
The clip art example "Weather - Vector stencils library" was created using the ConceptDraw PRO diagramming and vector drawing software extended with the Nature solution from the Illustration area of ConceptDraw Solution Park.
www.conceptdraw.com/ solution-park/ illustrations-nature
Sunny

Cloudy

Overcast

Snow

Rain

Lightning

Hot

Warm

Frost

Mist

Strong wind

Flood

Tsunami

Dew

Hoar-frost

Earthquake

Snowflake

- Pressure Gauge And Thermometer Symbol In Hvac
- Mechanical Drawing Symbols | Symbol Pressure Gauge Piping
- Symbol For Pressure Gauge
- Symbol Of Strain Gauge
- Flow Diagram In Pressure Gauge
- Symbol For Pressure Transducer On A Drawing
- Instruments - Vector stencils library | Engineering Symbol For Orifice
- Pressure Transducer Symbol
- Strain Gauge Electrical Symbol
- Meter Gauge Symbol
- Mechanical Drawing Symbols | Design elements - Fluid power ...
- Hydraulic Operation Symbols Gauge
- Sensor And Indicator Symbol
- Fluid Level Gauge Symbol
- Analog Sensor Symbol
- Electrical Symbols , Electrical Diagram Symbols | Electrical Symbols ...
- Thermocouple Sensor Symbol
- Electrical Symbols — Composite Assemblies | Instruments - Vector ...
- Electrical Symbols — Thermo | Electrical Symbols — Resistors ...
- Flow Meter Symbol In P Id