Active Directory Domain Services


"Dimensions of service quality.
A customer's expectation of a particular service is determined by factors such as recommendations, personal needs and past experiences. The expected service and the perceived service sometimes may not be equal, thus leaving a gap. The service quality model or the ‘GAP model’ developed by a group of authors- Parasuraman, Zeithaml and Berry at Texas and North Carolina in 1985 , highlights the main requirements for delivering high service quality. It identifies five ‘gaps’ that cause unsuccessful delivery. Customers generally have a tendency to compare the service they 'experience' with the service they 'expect' . If the experience does not match the expectation , there arises a gap. Ten determinants that may influence the appearance of a gap were described by Parasuraman, Zeithaml and Berry. in the SERVQUAL model: reliability, responsiveness, competence, access, courtesy, communication, credibility, security, understanding the customer and tangibles.
Later, the determinants were reduced to five: tangibles; reliability; responsiveness; service assurance and empathy in the so called RATER model." [Service quality. Wikipedia]
The block diagram example "Gap model of service quality" was created using the ConceptDraw PRO diagramming and vector drawing software extended with the Block Diagrams solution from the area "What is a Diagram" of ConceptDraw Solution Park.
Block diagram

"Ecosystems represent sources of natural capital and provide goods and services to society, also called ecosystem services. The Millennium Ecosystem Assessment identified over 24 ecosystem services that can be divided up into 4 general groups including: 1) provisioning, 2) supporting, 3) regulating and 4) cultural." [User:Sawtoothgirl/ Sustainable Real Estate Development. Wikipedia]
"Humankind benefits in a multitude of ways from ecosystems. Collectively, these benefits are known as ecosystem services. Ecosystem services are regularly involved in the provisioning of clean drinking water and the decomposition of wastes. While scientists and environmentalists have discussed ecosystem services implicitly for decades, these the ecosystem services concept itself was popularized by the Millennium Ecosystem Assessment (MA) in the early 2000s. This grouped ecosystem services into four broad categories: provisioning, such as the production of food and water; regulating, such as the control of climate and disease; supporting, such as nutrient cycles and crop pollination; and cultural, such as spiritual and recreational benefits. To help inform decision-makers, many ecosystem services are being assigned economic values." [Ecosystem services. Wikipedia]
The segmented pyramid diagram example "Ecosystem goods and services" was redesigned using the ConceptDraw PRO diagramming and vector drawing software from Wikimedia Commons file ES_ triangle.png.
[commons.wikimedia.org/ wiki/ File:ES_ triangle.png]
This file is licensed under the Creative Commons Attribution-Share Alike 3.0 Unported license. [creativecommons.org/ licenses/ by-sa/ 3.0/ deed.en]
This segmented pyramid diagram example "Ecosystem goods and services" is included in the Pyramid Diagrams solution from the Marketing area of ConceptDraw Solution Park.
Pyramid diagram

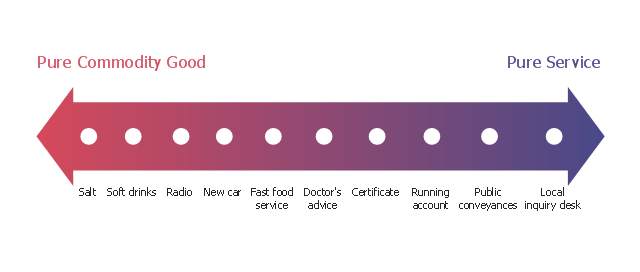
"The dichotomy between physical goods and intangible services is an oversimplification; these are not discrete categories. Most business theorists see a continuum with pure service at one endpoint and pure commodity goods at the other endpoint. Most products fall between these two extremes. Goods are normally structural and can be transferred in an instant while services are delivered over a period of time. Goods can be returned while a service once delivered cannot. Goods are not always tangible and may be virtual." [Goods and services. Wikipedia]
The example "Service-goods continuum diagram" was created using the ConceptDraw PRO diagramming and vector drawing software extended with the Marketing Diagrams solution from the Marketing area of ConceptDraw Solution Park.
The example "Service-goods continuum diagram" was created using the ConceptDraw PRO diagramming and vector drawing software extended with the Marketing Diagrams solution from the Marketing area of ConceptDraw Solution Park.
Service-goods continuum
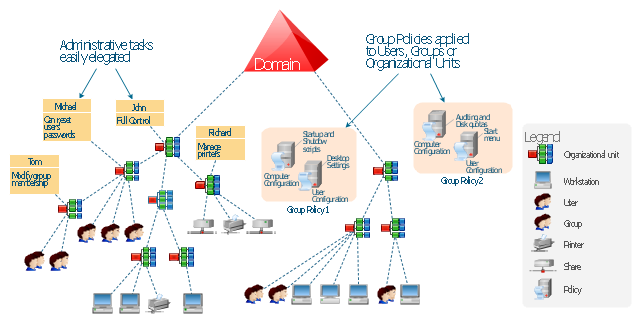
This example was drawn on the base of the Figure 2 illustrating the "Active Directory FAQ" from the website "Information Management Systems & Services" (IMSS) of the California Institute of Technology (Caltech) campus. [imss.caltech.edu/ node/ 412]
"By using the Active Directory® Domain Services (AD DS) server role, you can create a scalable, secure, and manageable infrastructure for user and resource management, and you can provide support for directory-enabled applications, such as Microsoft® Exchange Server. ...
AD DS provides a distributed database that stores and manages information about network resources and application-specific data from directory-enabled applications. Administrators can use AD DS to organize elements of a network, such as users, computers, and other devices, into a hierarchical containment structure. The hierarchical containment structure includes the Active Directory forest, domains in the forest, and organizational units (OUs) in each domain. A server that is running AD DS is called a domain controller." [technet.microsoft.com/ en-us/ library/ 9a5cba91-7153-4265-adda-c70df2321982]
The Active Directory Domain Services diagram example was created using the ConceptDraw PRO diagramming and vector drawing software extended with the Active Directory Diagrams solution from the Computer and Networks area of ConceptDraw Solution Park.
Active Directory hierarchical structure
HelpDesk
How to Create an AWS Architecture Diagram

- Service -goods continuum diagram | Process Flowchart | How To ...
- Cloud Computing Diagrams | How To create Diagrams for Amazon ...
- Web Service Diagram
- Process Flowchart | Amazon Web Services Diagrams diagramming ...
- How To create Diagrams for Amazon Web Services architecture ...
- Block diagram - Gap model of service quality | Process Flowchart ...
- Enterprise Architecture Diagrams | Amazon Web Services Diagrams ...
- UML use case diagram - Banking system
- Service -goods continuum diagram | Marketing diagrams - Vector ...
- Amazon Web Services Diagrams diagramming tool for architecture ...
- Er Diagram For Cab Services
- How to Create an AWS Architecture Diagram | Amazon Web ...
- Aws Services Diagram
- Active Directory Diagram | Active Directory Domain Services ...
- Computer and Networks Area | Active Directory Diagram | Amazon ...
- AWS Architecture Diagrams | Amazon Web Services Diagrams ...
- How To create Diagrams for Amazon Web Services architecture ...
- Active Directory Domain Services
- UML Use Case Diagram Example. Services UML Diagram . ATM ...
- Active Directory Diagram | Active Directory Domain Services | Active ...