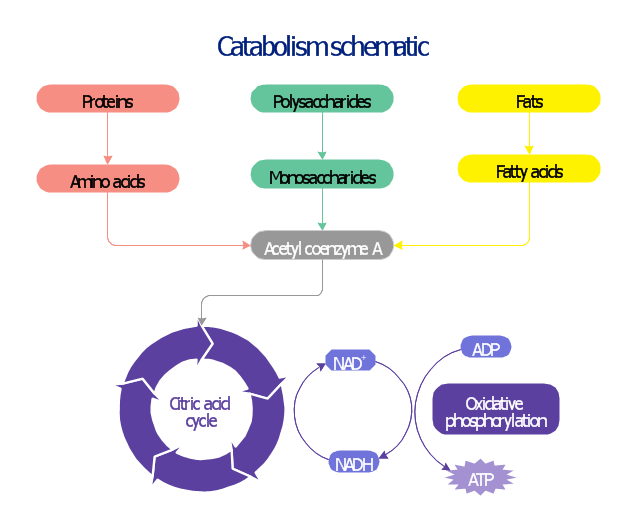
This biochemical chart display how proteins, polysaccharides and fats from food are digested into gastrointestinal tract into aminoacids, monosaccharides and fatty acids, and then broken down and oxidized to carbon dioxide and water in cellular processes of energy generation.
This metabolic pathway map was redesigned from Wikipedia file: Catabolism schematic.svg. [en.wikipedia.org/ wiki/ File:Catabolism_ schematic.svg]
The biochemical diagram example "Catabolism schematic" was created using the ConceptDraw PRO diagramming and vector drawing software extended with the Biology solution from the Science and Education area of ConceptDraw Solution Park.
Catabolic pathway map
 Biology
Biology solution extends ConceptDraw PRO software with samples, templates and libraries containing biological vector symbols, to help you create scientific and educational designs in the field of biology.
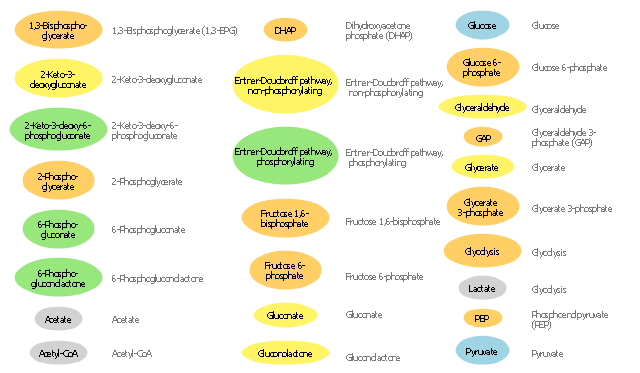
The vector stencils library "Carbohydrate metabolism" contains 25 icons of metabolite symbols.
Use these shapes for drawing carbohydrate metabolism schematics, biochemical diagrams and metabolic pathways maps.
"Carbohydrates are a superior short-term fuel for organisms because they are simpler to metabolize than fats or those amino acids (components of proteins) that can be used for fuel. In animals, the most important carbohydrate is glucose. The concentration of glucose in the blood is used as the main control for the central metabolic hormone, insulin. Starch, and cellulose in a few organisms (e.g., some animals ... and ... microorganisms), both being glucose polymers, are disassembled during digestion and absorbed as glucose. Some simple carbohydrates have their own enzymatic oxidation pathways, as do only a few of the more complex carbohydrates. The disaccharide lactose, for instance, requires the enzyme lactase to be broken into its monosaccharides components; many animals lack this enzyme in adulthood." [Carbohydrate metabolism. Wikipedia]
The shapes example "Design elements - Carbohydrate metabolism" is included in the Biology solution from the Science and Education area of ConceptDraw Solution Park.
Carbohydrate metabolite symbols
Process Flowchart


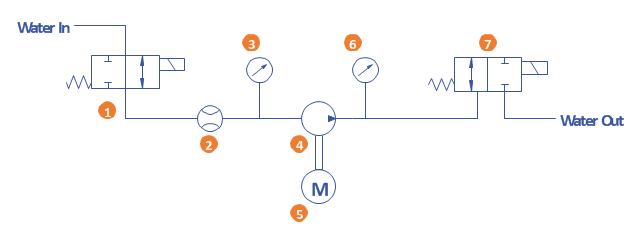
A simple hydraulic schematic showing apparatus for testing the strength of a hydraulic hose splice.
Water enters through normally closed solenoid valve (1) and passes through intake flow meter (2) to high pressure pump (4). Intake water pressure is monitored by pressure gauge (3). The hose to be tested connects between pump (4) and normally open solenoid activated drain valve (7). To test the hose, pump drive motor (5) is turned on, the solenoid of drain valve (7) is activated, closing the valve, and the pump is run to pressurize the hose. Test pressure is monitored by gauge (6). When the test is complete or the hose fails, the solenoid of drain valve (7) is deactivated, opening valve and discharging water, depressurizing the system. All components are operated electrically by a remote control circuit so that the operator may perform the test from a protected location, monitoring it with a camera and video monitor.
This hydraulic schematic example was redrawn using ConceptDraw PRO diagramming and vector drawing software from the Wikimedia Commons file: Hydraulic schematic.jpg.
[commons.wikimedia.org/ wiki/ File:Hydraulic_ schematic.jpg]
This file is licensed under the Creative Commons Attribution-Share Alike 3.0 Unported license.
[creativecommons.org/ licenses/ by-sa/ 3.0/ deed.en]
The hydraulic schematic example "Apparatus for testing the strength of a hydraulic hose splice" is included in the Mechanical Engineering solution from the Engineering area of ConceptDraw Solution Park.
Hydraulic system schematic
Landscape Plan

Biology Drawing

Biology Drawing Software

- Catabolism schematic - Biochemical diagram | Metabolic pathway ...
- Catabolism schematic | Glucose catabolism pathways map ...
- Methabolic Pathways Chart
- Glucose catabolism pathways map | Catabolism schematic ...
- Catabolism schematic | Biochemical metabolic pathway map ...
- Metabolic pathway map - Biochemical diagram | Catabolism ...
- Metabolic pathway map - Biochemical diagram | Glycolysis overview ...
- Design elements - TCA cycle | Catabolism schematic - Biochemical ...
- Metabolic pathway map - Biochemical diagram | Catabolism ...
- Schematic Glycolytic Pathway
- Bio Flowchart Lite | Metabolic pathway map - Biochemical diagram ...
- Biology | Biology Drawing Software | Biology Drawing | Diagram To ...
- Citric acid cycle (TCA cycle) | Biochemical metabolic pathway map ...
- Draw A Schematic Representation Of The Glycolytic Pathway
- Metabolic pathway map - Biochemical diagram | Design elements ...
- Catabolism schematic - Biochemical diagram | Biology | Metabolic ...
- Catabolism schematic | Schematic Catabolic Pathway
- Catabolism schematic | Methabolic Pathway Schematic
- Biology | Business Diagram Software | Catabolism schematic ...
- Catabolism schematic - Biochemical diagram | Biology | Biology ...