 Soccer
The Soccer (Football) Solution extends ConceptDraw DIAGRAM.5 (or later) software with samples, templates, and libraries of vector objects for drawing soccer (football) diagrams, plays schemas, and illustrations. It can be used to make professional looking
 Plant Layout Plans
Plant Layout Plans solution can be used for power plant design and plant layout design, for making the needed building plant plans and plant layouts looking professionally good. Having the newest plant layout software, the plant design solutions and in particular the ConceptDraw’s Plant Layout Plans solution, including the pre-made templates, examples of the plant layout plans, and the stencil libraries with the design elements, the architects, electricians, interior designers, builders, telecommunications managers, plant design engineers, and other technicians can use them to create the professionally looking drawings within only a few minutes.
 Histograms
How to make a Histogram? Making a Histogram is an incredibly easy process when it is done with ConceptDraw DIAGRAM. The Histograms Solution enhances ConceptDraw DIAGRAM functionality with extensive drawing tools, numerous samples, and examples; also a quick-start template and library of ready vector stencils for visualization the data and professional drawing Histograms.
 Engineering
This solution extends ConceptDraw DIAGRAM.4 with the ability to visualize industrial systems in electronics, electrical, chemical, process, and mechanical engineering.
HelpDesk
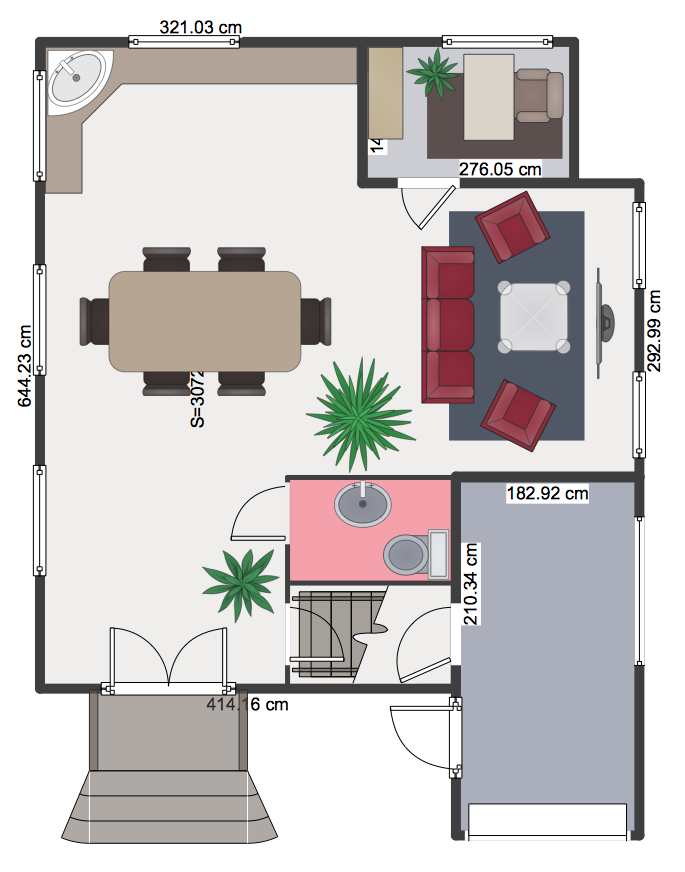
How to Create a Floor Plan
Software development with ConceptDraw DIAGRAM

 Rack Diagrams
The Rack Diagrams solution, including a vector stencil library, a collection of samples and a quick-start template, can be useful for all who deal with computer networks. Choosing any of the 54 library's vector shapes, you can design various types of Rack diagrams or Server rack diagrams visualizing 19" rack mounted computers and servers.
HelpDesk
How to Create a Bar Chart

 Directional Maps
Directional Maps solution extends ConceptDraw DIAGRAM software with templates, samples and libraries of vector stencils for drawing the directional, location, site, transit, road and route maps, plans and schemes.
- Landscaping Designs 2d Plan
- 2d Garden Arrangements
- 2d Floor Plan Lay Out Library
- 2d Floor Plan Software
- How To use Landscape Design Software | Restaurant Floor Plans ...
- Download 2d Design For Free
- Directional Maps | Car Symbol 2d
- 2d Design Software Free
- Parking Plan 2d
- Simple 2d Floor Plan Software
- Best 2d Design Software
- Free 2d Sketch Software
- How To use House Electrical Plan Software | Design elements ...
- 2d Landscape Design Software Free
- 2D Directional map - Template | Directional Maps | How To use ...
- 2d Design Software Free Download
- 2d Technical Drawing Software
- 2d Sketch Software
- 2d Architectural Drawing Software Free
- How To use Landscape Design Software | Building Drawing ...