HelpDesk
How to Create a House of Quality Diagram

 House of Quality
House of Quality solution provides the powerful drawing tools, numerous specific samples and examples, and set of vector design elements of House of Quality shapes and symbols, which will help you in application the Quality function deployment (QFD) methodology and in easy creation the House of Quality Matrices intended for satisfaction the consumers' desires and requirements, for representing them in a visual way and then transformation into the targets and technical requirements to be followed for development the best products.
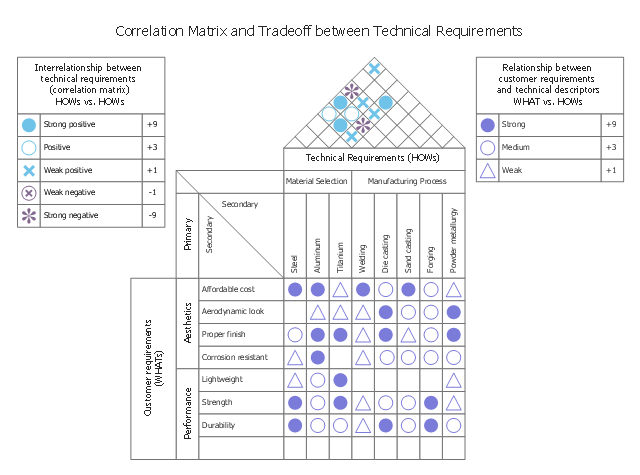
This house of quality sample illustrates correlation matrix.
It was designed on the base of the figure 3-5 in Lecture "How QFD helps in product quality improvement?" from the website of National Programme on Technology Enhanced Learning (NPTEL), India. [nptel.ac.in/ courses/ 110101010/ downloads/ mod3/ Module%20 III-Lec1.pdf]
Distributed under Creative Commons Attribution-ShareAlike 4.0 International (CC BY-SA 4.0) [creativecommons.org/ licenses/ by-sa/ 4.0/ ]
"After drafting the relationship matrix, it is evaluated for any empty row or column. An empty row indicates that a customer voice is not being addressed by any technical descriptors. Thus, the customer expectation is not being met. Any blank column indicates that the technical requirement is unnecessary, as it does not address any VOC.
The roof of the house of quality, expressed as correlation matrix, is used to identify any interrelationships between the technical descriptors (Figure 3-5). Symbols are used to describe the strength of the interrelationships. Symbols generally preferred are:
- A ‘solid circle’ represents a strong positive relationship.
- A ‘circle’ represents a positive relationship.
- An ‘X’ represents a negative relationship.
- An ‘asterisk’ represents a strong negative relationship." [nptel.ac.in/ courses/ 110101010/ modules/ module3/ lec1/ 1.7.html]
The HOQ example "House of Quality - correlation matrix" was designed using ConceptDraw PRO software extended with House of Quality solution from Quality area of ConceptDraw PRO Solution Park.
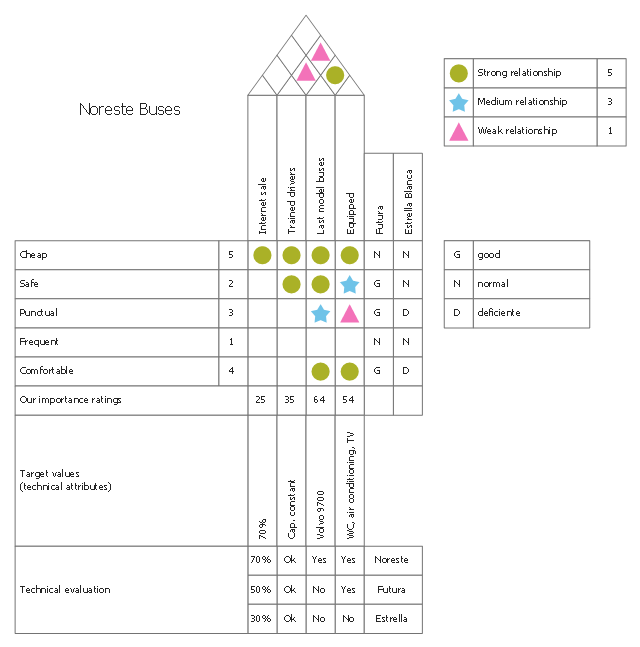
HOQ of a handlebar stem in a bicycle
This house of quality matrix sample was designed on the base of the Wikimedia Commons file: Casa de la calidad QFD.png.
[commons.wikimedia.org/ wiki/ File:A1_ House_ of_ Quality.png]
This file is made available under the Creative Commons CC0 1.0 Universal Public Domain Dedication. [creativecommons.org/ publicdomain/ zero/ 1.0/ deed.en]
"The house of quality, a part of QFD, identifies and classifies customer desires, identifies the importance of those desires, identifies engineering characteristics which may be relevant to those desires, correlates the two, allows for verification of those correlations, and then assigns objectives and priorities for the system requirements. This process can be applied at any system composition level (e.g. system, subsystem, or component) in the design of a product, and can allow for assessment of different abstractions of a system." [Quality function deployment. Wikipedia]
The HOQ example "House of quality of buses" was designed using ConceptDraw PRO software extended with House of Quality solution from Quality area of ConceptDraw PRO Solution Park.
HOQ matrix
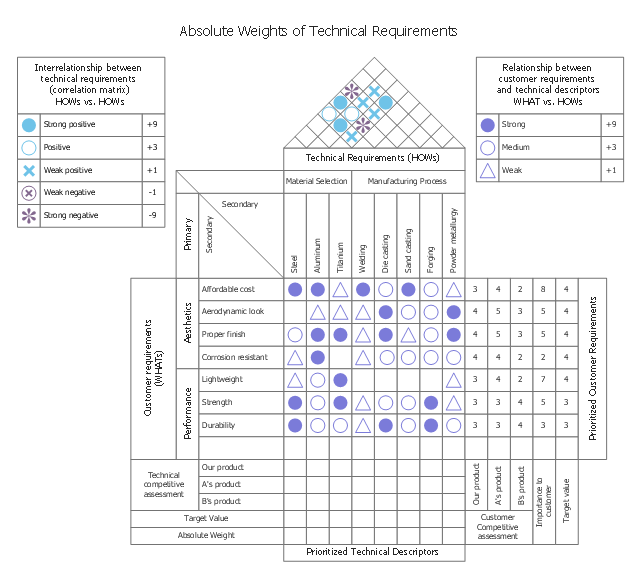
This house of quality sample illustrates prioritized technical descriptors.
It was designed on the base of the figure 3-7 in Lecture "How QFD helps in product quality improvement?" from the website of National Programme on Technology Enhanced
Learning (NPTEL), India. [nptel.ac.in/ courses/ 110101010/ downloads/ mod3/ Module%20 III-Lec1.pdf]
Distributed under Creative Commons Attribution-ShareAlike 4.0 International (CC BY-SA 4.0) [creativecommons.org/ licenses/ by-sa/ 4.0/ ]
"The technical competitive assessment makes up a block of rows corresponding to each technical descriptor in the house of quality beneath the relationship matrix. After respective technical factors have been established, the products are evaluated for each technical factor that addresses VOC.
Similar to the customer competitive assessment, the data recorded are in a scale of 1 through 5, to indicate a rating, 1 for worst and 5 for best. The technical competitive assessment is often useful in uncovering gaps in engineering judgment.
Importance ratings represent the relative importance of customer requirement in terms of each other.
The target-value of column can be on the same scale as the customer competitive assessment (1 for worst, 5 for best can be used). This column is where the QFD team decides whether they want to keep their product unchanged, improve the product, or make the product better than the competitor.
The prioritized technical descriptors make up a block of rows corresponding to the technical descriptor in the house of quality below the technical competitive assessment as shown in Figure 3-7. These prioritized technical descriptors contain target value and absolute weights." [nptel.ac.in/ courses/ 110101010/ modules/ module3/ lec1/ 1.9.html]
The HOQ example "House of Quality - prioritized technical descriptors" was designed using ConceptDraw PRO software extended with House of Quality solution from Quality area of ConceptDraw PRO Solution Park.
HOQ of a handlebar stem in a bicycle
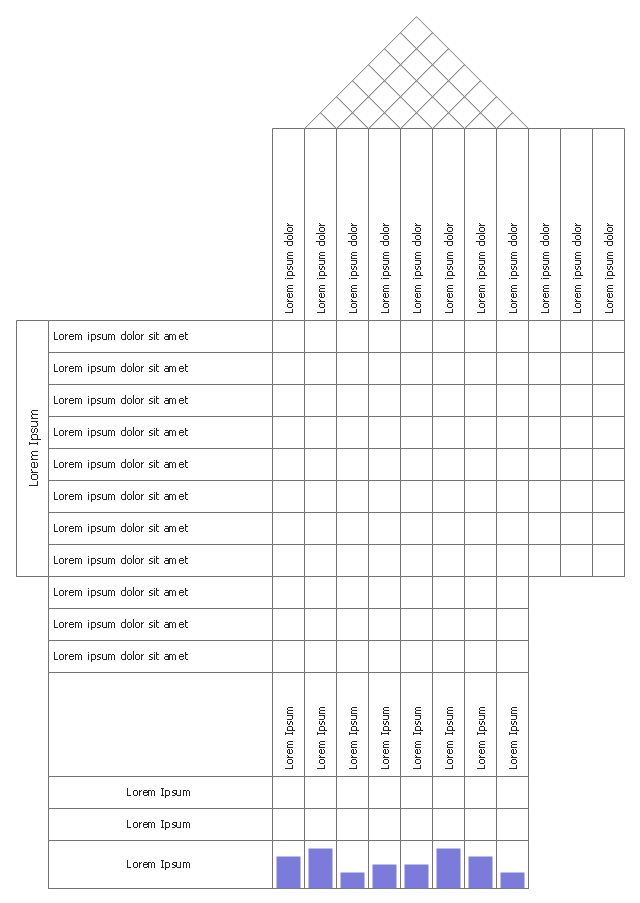
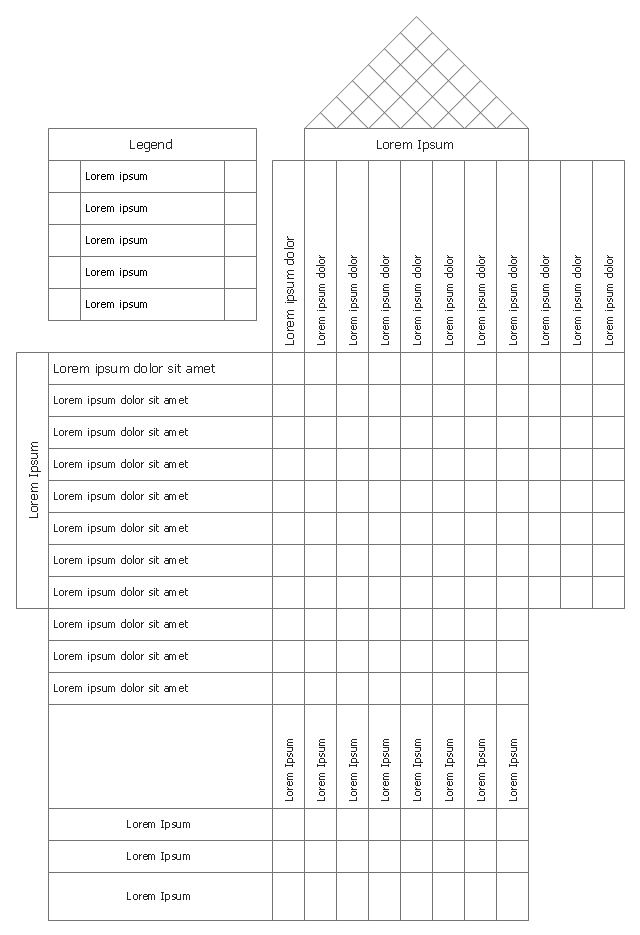
Use this house of quality template to design your house of quality diagrams and quality function deployment matrices.
The HOQ template "QFD matrix" was designed using ConceptDraw PRO software extended with House of Quality solution from Quality area of ConceptDraw PRO Solution Park.
House of Quality
Use this house of quality template to design your HOQ matrices.
The HOQ template "HOQ matrix" was designed using ConceptDraw PRO software extended with House of Quality solution from Quality area of ConceptDraw PRO Solution Park.
The HOQ template "HOQ matrix" was designed using ConceptDraw PRO software extended with House of Quality solution from Quality area of ConceptDraw PRO Solution Park.
House of Quality
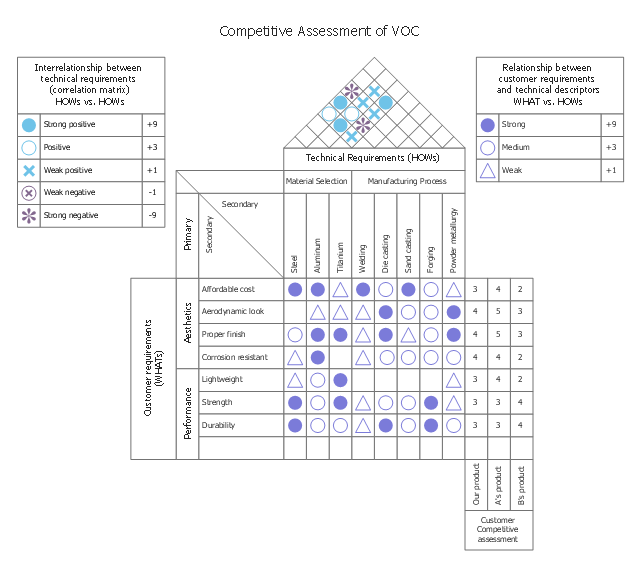
This house of quality sample illustrates competative assessment of voice of the customer (VOC).
It was designed on the base of the figure 3-6 in Lecture "How QFD helps in product quality improvement?" from the website of National Programme on Technology Enhanced
Learning (NPTEL), India. [nptel.ac.in/ courses/ 110101010/ downloads/ mod3/ Module%20 III-Lec1.pdf]
Distributed under Creative Commons Attribution-ShareAlike 4.0 International (CC BY-SA 4.0) [creativecommons.org/ licenses/ by-sa/ 4.0/ ]
"The customer’s competitive assessment (Figure 3-6) is a pair of table (or graph) that depicts how competitive products compare with current organization product status on specific VOC. The customer competitive assessment is the block of columns corresponding to each customer requirement in the house of quality on the right side of the relationship matrix, The numbers 1 through 5 are listed in the competitive evaluation column to indicate a rating of 1 for worst and 5 for best. The customer competitive assessment is a good way to determine if the customer voice has been met (as compared to best competitor) and identify areas to improvement for future design." [nptel.ac.in/ courses/ 110101010/ modules/ module3/ lec1/ 1.8.html]
The HOQ example "House of Quality - customer’s competitive assessment" was designed using ConceptDraw PRO software extended with House of Quality solution from Quality area of ConceptDraw PRO Solution Park.
HOQ of a handlebar stem in a bicycle
Product Planning

This house of quality sample illustrates correlation matrix.
It was designed on the base of the figure 3-5 in Lecture "How QFD helps in product quality improvement?" from the website of National Programme on Technology Enhanced Learning (NPTEL), India. [nptel.ac.in/ courses/ 110101010/ downloads/ mod3/ Module%20 III-Lec1.pdf]
Distributed under Creative Commons Attribution-ShareAlike 4.0 International (CC BY-SA 4.0) [creativecommons.org/ licenses/ by-sa/ 4.0/ ]
"After drafting the relationship matrix, it is evaluated for any empty row or column. An empty row indicates that a customer voice is not being addressed by any technical descriptors. Thus, the customer expectation is not being met. Any blank column indicates that the technical requirement is unnecessary, as it does not address any VOC.
The roof of the house of quality, expressed as correlation matrix, is used to identify any interrelationships between the technical descriptors (Figure 3-5). Symbols are used to describe the strength of the interrelationships. Symbols generally preferred are:
- A ‘solid circle’ represents a strong positive relationship.
- A ‘circle’ represents a positive relationship.
- An ‘X’ represents a negative relationship.
- An ‘asterisk’ represents a strong negative relationship." [nptel.ac.in/ courses/ 110101010/ modules/ module3/ lec1/ 1.7.html]
The HOQ example "House of Quality - correlation matrix" was designed using ConceptDraw PRO software extended with House of Quality solution from Quality area of ConceptDraw PRO Solution Park.
It was designed on the base of the figure 3-5 in Lecture "How QFD helps in product quality improvement?" from the website of National Programme on Technology Enhanced Learning (NPTEL), India. [nptel.ac.in/ courses/ 110101010/ downloads/ mod3/ Module%20 III-Lec1.pdf]
Distributed under Creative Commons Attribution-ShareAlike 4.0 International (CC BY-SA 4.0) [creativecommons.org/ licenses/ by-sa/ 4.0/ ]
"After drafting the relationship matrix, it is evaluated for any empty row or column. An empty row indicates that a customer voice is not being addressed by any technical descriptors. Thus, the customer expectation is not being met. Any blank column indicates that the technical requirement is unnecessary, as it does not address any VOC.
The roof of the house of quality, expressed as correlation matrix, is used to identify any interrelationships between the technical descriptors (Figure 3-5). Symbols are used to describe the strength of the interrelationships. Symbols generally preferred are:
- A ‘solid circle’ represents a strong positive relationship.
- A ‘circle’ represents a positive relationship.
- An ‘X’ represents a negative relationship.
- An ‘asterisk’ represents a strong negative relationship." [nptel.ac.in/ courses/ 110101010/ modules/ module3/ lec1/ 1.7.html]
The HOQ example "House of Quality - correlation matrix" was designed using ConceptDraw PRO software extended with House of Quality solution from Quality area of ConceptDraw PRO Solution Park.
HOQ of a handlebar stem in a bicycle
- House of Quality - correlation matrix
- How To use House Plan Software | How To use House Electrical ...
- Roof Shaped Matrix
- Quality fishbone diagram - Template | Cause and Effect Diagrams ...
- HVAC Plans | How to Create a HVAC Plan | Air handler- HVAC plan ...
- How To Create an Involvement Matrix | CORRECTIVE ACTIONS ...
- How To use House Electrical Plan Software | Lighting Plan Symbols ...
- Lighting and switch layout | Classroom lighting - Reflected ceiling ...
- Interior Design School Layout - Design Elements | Building Drawing ...
- Landscape Design In Roof