 Entity-Relationship Diagram (ERD)
Entity-Relationship Diagram (ERD) solution extends ConceptDraw DIAGRAM software with templates, samples and libraries of vector stencils from drawing the ER-diagrams by Chen's and crow’s foot notations.
 Entity-Relationship Diagram (ERD)
An Entity-Relationship Diagram (ERD) is a visual presentation of entities and relationships. That type of diagrams is often used in the semi-structured or unstructured data in databases and information systems. At first glance ERD is similar to a flowch
Business diagrams & Org Charts with ConceptDraw DIAGRAM
The business diagrams are in great demand, they describe the business processes, business tasks and activities which are executed to achieve specific organizational and business goals, increase productivity, reduce costs and errors. They let research and better understand the business processes. ConceptDraw DIAGRAM is a powerful professional cross-platform business graphics and business flowcharting tool which contains hundreds of built-in collections of task-specific vector stencils and templates. They will help you to visualize and structure information, create various Business flowcharts, maps and diagrams with minimal efforts, and add them to your documents and presentations to make them successful. Among them are Data flow diagrams, Organization charts, Business process workflow diagrams, Audit flowcharts, Cause and Effect diagrams, IDEF business process diagrams, Cross-functional flowcharts, PERT charts, Timeline diagrams, Calendars, Marketing diagrams, Pyramids, Target diagrams, Venn diagrams, Comparison charts, Analysis charts, Dashboards, and many more. Being a cross-platform application, ConceptDraw DIAGRAM is very secure, handy, free of bloatware and one of the best alternatives to Visio for Mac users.
HelpDesk
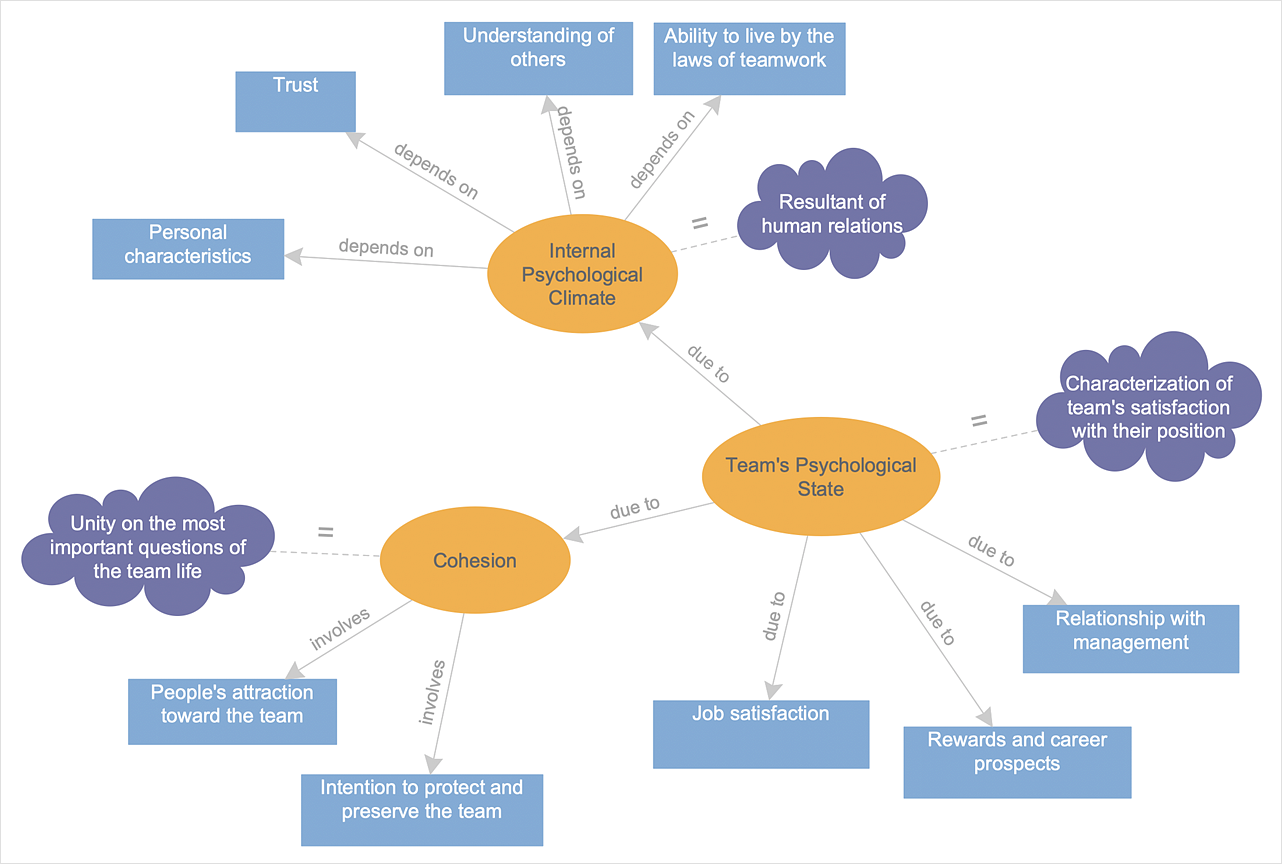
How to Create a Concept Map
The graphical technique of knowledge representation in the form of structured networks of concepts (ideas) is called concept mapping. Concept network consists of shapes that represent concepts and connectors representing relationships between concepts. The difference between mind maps and concept maps is that a mind map has only one object depicting the main idea, while a concept map may have several. Concept mapping is used to structure ideas, to communicate a complex system of knowledge, to help the learning process, etc. ConceptDraw DIAGRAM allows you to draw concept maps using the Concept Map solution.Data modeling with ConceptDraw DIAGRAM
Data modelling will help you to study and analyze business processes in your organization for optimization and increase of effectiveness and production.
 Venn Diagrams
Venn Diagrams are actively used to illustrate simple set relationships in set theory and probability theory, logic and statistics, mathematics and computer science, linguistics, sociology, and marketing. Venn Diagrams are also often used to visually summarize the status and future viability of a project.
- Entity - Relationship Diagram ( ERD ) | Basic Flowchart Symbols and ...
- Entity - Relationship Diagram ( ERD ) | The Reed-Kellogg system ...
- Entity - Relationship Diagram ( ERD ) | Sentence Diagram | Workflow ...
- Entity Relationship Diagram Symbols | Basic Flowchart Symbols and ...
- Entity Relationship Diagram Software for Mac | ER diagram tool for ...
- Entity Relationship Diagram - ERD - Software for Design Crows Foot ...
- Basic Flowchart Symbols and Meaning | Process Flowchart | Entity ...
- How to Diagram Sentences in ConceptDraw PRO | Language ...
- Online Diagram Tool | Flow Chart Online | Entity Relationship ...
- Sentence Diagram | How to Diagram Sentences in ConceptDraw ...
- Entity Relationship Diagram Symbols and Meaning ERD Symbols ...
- Entity - Relationship Diagram ( ERD ) | ConceptDraw PRO Network ...
- Examples of Reed-Kellogg diagrams | Entity - Relationship Diagram ...
- Fishbone Diagram | SSADM Diagram | Entity - Relationship Diagram ...
- Entity Relationship Diagram Symbols and Meaning ERD Symbols ...
- Entity - Relationship Diagram ( ERD ) | How To Create a Concept Map ...
- Entity - Relationship Diagram
- SWOT analysis for a small independent bookstore | Entity ...
- Entity Relationship Diagram Examples | Entity Relationship Diagram ...
- Entity Relationship Diagram Symbols and Meaning ERD Symbols ...


