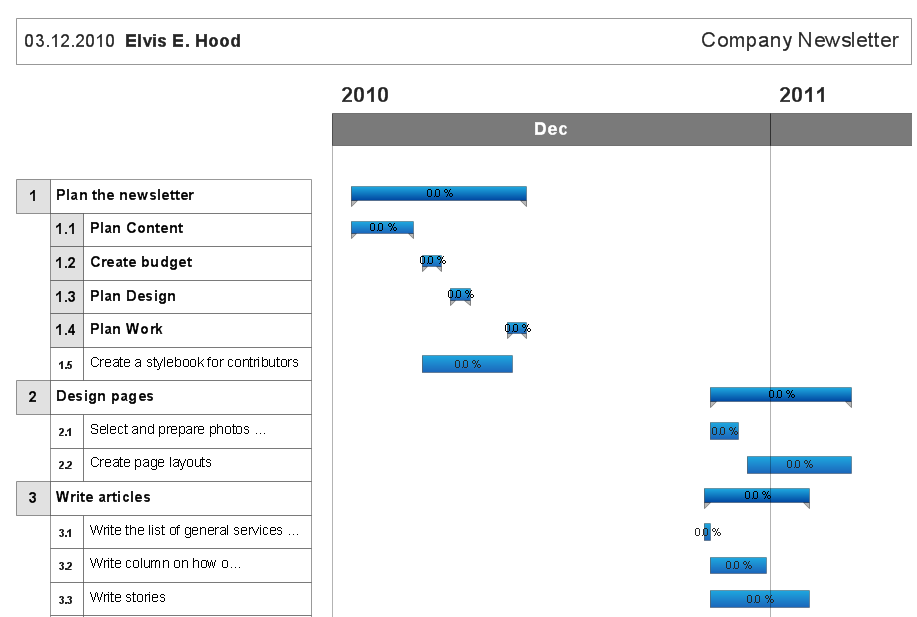
How to Report Task's Execution with Gantt Chart

HelpDesk
How to Create Project Diagrams on PC

HelpDesk
How to Create a Timeline Diagram

 Timeline Diagrams
Timeline Diagrams solution extends ConceptDraw DIAGRAM diagramming software with samples, templates and libraries of specially developed smart vector design elements of timeline bars, time intervals, milestones, events, today marker, legend, and many other elements with custom properties, helpful for professional drawing clear and intuitive Timeline Diagrams. Use it to design simple Timeline Diagrams and designate only the main project stages, or highly detailed Timeline Diagrams depicting all project tasks, subtasks, milestones, deadlines, responsible persons and other description information, ideal for applying in presentations, reports, education materials, and other documentation.
HelpDesk
How to Draw a Gantt Chart

Timeline charts presents events and time periods on a chronological scale. They are used in project management to visualize project milestones and upper level phases, and show project progress.
"Within the framework of project management, a milestone is an event that receives special attention. It is often put at the end of a stage to mark the completion of a work package or phase. Milestones can be put before the end of a phase so that corrective actions can be taken, if problems arise, and the deliverable can be completed on time.
In addition to signaling the completion of a key deliverable, a milestone may also signify an important decision or the derivation of a critical piece of information, which outlines or affects the future of a project. In this sense, a milestone not only signifies distance traveled (key stages in a project) but also indicates direction of travel since key decisions made at milestones may alter the route through the project plan." [Milestone (project management). Wikipedia]
This timeline diagram example was created using the ConceptDraw PRO diagramming and vector drawing software extended with the Timeline Diagrams solution from the Management area of ConceptDraw Solution Park.
Timeline

Gantt Chart Diagram
Timeline charts presents events and time periods on a chronological scale. They are used in project management to visualize project milestones and upper level phases, and show project progress.
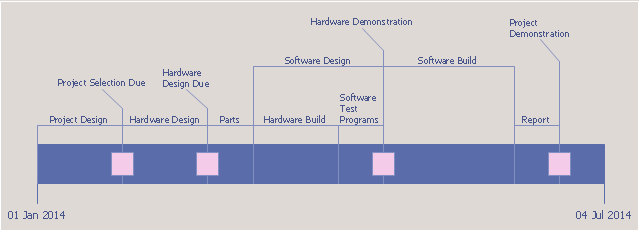
"... timeline is used for project management. In these cases, timelines are used to help team members to know what milestones need to be achieved and under what time schedule. For example, in the case of establishing a project timeline in the implementation phase of the life cycle of a computer system." [Timeline. Wikipedia]
This project timeline diagram example was created using the ConceptDraw PRO diagramming and vector drawing software extended with the Timeline Diagrams solution from the Management area of ConceptDraw Solution Park.
Project timeline
- Milestone Project Management Example
- Milestone Chart
- How to Report Task's Execution with Gantt Chart | PERT chart ...
- Pertt Chart With Milestones Example
- Milestone Chart Template
- Project Milestone Diagram
- Project management life cycle - Flowchart | PM Dashboards ...
- Milestone Diagram
- Timeline diagram | Project timeline diagram | Timeline Diagrams ...
- How to Identify Project Milestones | How to Create a Timeline ...