This example was redesigned from the Wikipedia file: LastResortHotel BookRoom Process.png. [en.wikipedia.org/ wiki/ File:LastResortHotel_ BookRoom_ Process.png]
This file is licensed under the Creative Commons Attribution-ShareAlike 3.0 License. [creativecommons.org/ licenses/ by-sa/ 3.0/ ]
"Event partitioning is an easy-to-apply systems analysis technique that helps the analyst organize requirements for large systems into a collection of smaller, simpler, minimally-connected, easier-to-understand ‘mini systems’ / use cases. ...
Defining requirements.
Single process in a fictitious hotel using data flow diagram notation.
Single use case in a fictitious hotel using use case diagram notation.
This approach helps the analyst to decompose the system into ‘mentally bite-sized’ mini-systems using events that require a planned response. The level of detail of each response is at the level of ‘primary use cases’. Each planned response may be modelled using DFD notation or as a single use case using use case diagram notation.
The basic flow within a process or use case can usually be described in a relatively small number of steps, often fewer than twenty or thirty, possibly using something like ‘structured English’. Ideally, all of the steps would be visible all at once (often a page or less). The intention is to reduce one of the risks associated with short-term memory, namely, forgetting what is not immediately visible (‘out of sight, out of mind’). ...
Single process in a fictitious hotel using data flow diagram notation." [Event partitioning. Wikipedia]
The DFD example "Last resort hotel book room process" was created using the ConceptDraw PRO diagramming and vector drawing software extended with the Data Flow Diagrams solution from the Software Development area of ConceptDraw Solution Park.
DFD

DroidDia PRO unlocker
.jpg "droiddia pro unlocker")
This is a schematic process flow diagram of the processes used in a typical oil refinery.
This process flow diagram (PFD) example was redesigned from the Wikimedia Commons file: RefineryFlow.png. [commons.wikimedia.org/ wiki/ File:RefineryFlow.png]
This file is licensed under the Creative Commons Attribution-Share Alike 3.0 Unported license. [creativecommons.org/ licenses/ by-sa/ 3.0/ deed.en]
"An oil refinery or petroleum refinery is an industrial process plant where crude oil is processed and refined into more useful products such as petroleum naphtha, gasoline, diesel fuel, asphalt base, heating oil, kerosene and liquefied petroleum gas. Oil refineries are typically large, sprawling industrial complexes with extensive piping running throughout, carrying streams of fluids between large chemical processing units. In many ways, oil refineries use much of the technology of, and can be thought of, as types of chemical plants. The crude oil feedstock has typically been processed by an oil production plant. There is usually an oil depot (tank farm) at or near an oil refinery for the storage of incoming crude oil feedstock as well as bulk liquid products.
An oil refinery is considered an essential part of the downstream side of the petroleum industry." [Oil refinery. Wikipedia]
The PFD example "Process flow diagram - Typical oil refinery" was created using the ConceptDraw PRO diagramming and vector drawing software extended with the Chemical and Process Engineering solution from the Chemical and Process Engineering area of ConceptDraw Solution Park.
Process Flow Diagram (PFD)
-process-flow-diagram---typical-oil-refinery.png--diagram-flowchart-example.png)
This cycle process chart was redesigned from the Wikimedia Commons file: Business Feedback Loop PNG version.png.
"A business ideally is continually seeking feedback from customers: are the products helpful? are their needs being met? Constructive criticism helps marketers adjust offerings to meet customer needs."
[commons.wikimedia.org/ wiki/ File:Business_ Feedback_ Loop_ PNG_ version.png]
The cycle process diagram example "Business feedback loop" was created using the ConceptDraw PRO diagramming and vector drawing software extended with the Sales Flowcharts solution from the Marketing area of ConceptDraw Solution Park.
Customers feedback cycle process chart

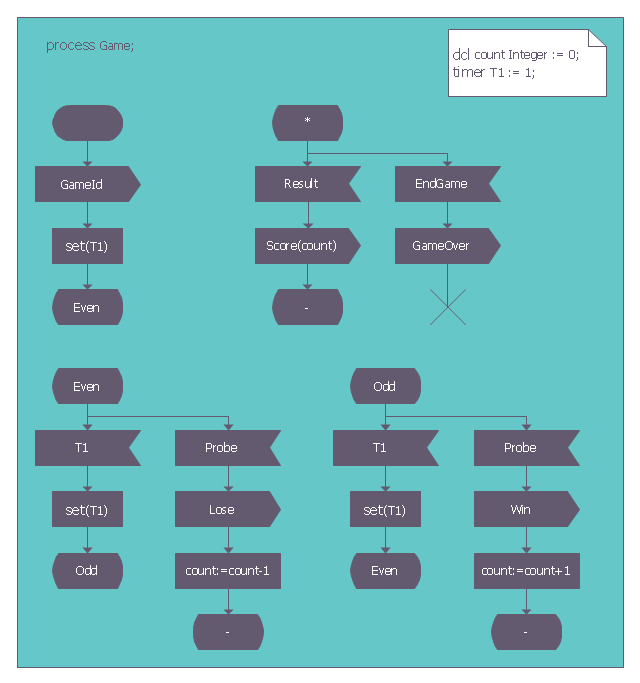
This SDL diagram example was redesigned from the Wikimedia Commons file: SDL processGame.png.
"Diagram of the process Game in SDL (Specification and Description Language)." [commons.wikimedia.org/ wiki/ File:SDL_ processGame.png]
This file is made available under the Creative Commons CC0 1.0 Universal Public Domain Dedication. [creativecommons.org/ publicdomain/ zero/ 1.0/ deed.en]
The diagram example "SDL process Game" was created using the ConceptDraw PRO diagramming and vector drawing software extended with the Specification and Description Language (SDL) solution from the Engineering area of ConceptDraw Solution Park.
SDL diagram exampe
This PFD of jet fuel mercaptan oxidation treating was redrawn from Wikipedia file: ConvLPGMerox.png. [en.wikipedia.org/ wiki/ File:ConvKeroMerox.png]
This file is licensed under the Creative Commons Attribution-Share Alike 3.0 Unported icense. [creativecommons.org/ licenses/ by-sa/ 3.0/ deed.en]
"Merox is an acronym for mercaptan oxidation. It is a proprietary catalytic chemical process developed by UOP used in oil refineries and natural gas processing plants to remove mercaptans from LPG, propane, butanes, light naphthas, kerosene and jet fuel by converting them to liquid hydrocarbon disulfides.
The Merox process requires an alkaline environment which, in some of the process versions, is provided by an aqueous solution of sodium hydroxide (NaOH), a strong base, commonly referred to as caustic. In other versions of the process, the alkalinity is provided by ammonia, which is a weak base.
The catalyst in some versions of the process is a water-soluble liquid. In other versions, the catalyst is impregnated onto charcoal granules.
Processes within oil refineries or natural gas processing plants that remove mercaptans and/ or hydrogen sulfide (H2S) are commonly referred to as sweetening processes because they results in products which no longer have the sour, foul odors of mercaptans and hydrogen sulfide. The liquid hydrocarbon disulfides may remain in the sweetened products, they may be used as part of the refinery or natural gas processing plant fuel, or they may be processed further.
The Merox process is usually more economical than using a catalytic hydrodesulfurization process for much the same purpose." [en.wikipedia.org/ wiki/ Merox]
The process flow diagram (PFD) example "Jet fuel mercaptan oxidation treating" was drawn using the ConceptDraw PRO software extended with the Chemical and Process Engineering solution from the Chemical and Process Engineering area of ConceptDraw Solution Park.
Process flow diagram (PFD)
-jet-fuel-mercaptan-oxidation-treating---pfd.png--diagram-flowchart-example.png)
A five level pyramid model of different types of Information Systems based on the information processing requirement of different levels in the organization. The first level represents transaction processing systems to process basic data. The second level represents office support systems to process information in office. The third level represents management information systems to process information by managers. The fourth level represents decision support systems to process explicit knowledge. The fifth level represents executive information systems to process tacit knowledge.
"A Computer(-Based) Information System is essentially an IS using computer technology to carry out some or all of its planned tasks. The basic components of computer based information system are:
(1) Hardware - these are the devices like the monitor, processor, printer and keyboard, all of which work together to accept, process, show data and information.
(2) Software - are the programs that allow the hardware to process the data.
(3) Databases - are the gathering of associated files or tables containing related data.
(4) Networks - are a connecting system that allows diverse computers to distribute resources.
(5) Procedures - are the commands for combining the components above to process information and produce the preferred output.
The first four components (hardware, software, database and network) make up what is known as the information technology platform. Information technology workers could then use these components to create information systems that watch over safety measures, risk and the management of data. These actions are known as information technology services." [Information systems. Wikipedia]
This pyramid diagram was redesigned using the ConceptDraw PRO diagramming and vector drawing software from Wikimedia Commons file Five-Level-Pyramid-model.png. [commons.wikimedia.org/ wiki/ File:Five-Level-Pyramid-model.png]
This file is licensed under the Creative Commons Attribution 3.0 Unported license. [creativecommons.org/ licenses/ by/ 3.0/ deed.en]
The triangle chart example "Information systems types" is included in the Pyramid Diagrams solution from the Marketing area of ConceptDraw Solution Park.
Pyramid diagram

- Reminders - Template | iPhone User Interface | Process Flowchart ...
- Process Flowchart | Restaurant Floor Plans Software | Photography ...
- Process Vector Png
- Event-driven Process Chain Diagrams | An Open Exercise Book Png
- SWOT Matrix Template | Process Flowchart | Pyramid Diagram ...
- Professions - Vector stencils library | Process Flowchart | Png ...
- Arrow Flow Png
- Process Flowchart | Accountant Png Cartoon Graphic Pics
- Cycle Process Png
- Process Flowchart | Sales Process Flowchart Symbols | F&B ...
- Process Flowchart | HR symbols - Vector stencils library | PDCA ...
- People - Vector stencils library | Process Flowchart | Photography ...
- Value stream map parts | Hiring Process | Hiring process workflow ...
- Process Flowchart | Product Overview | Entity-Relationship Diagram ...
- Cross-Functional Flowchart - to draw cross functional process maps ...
- The Best Business Process Modeling Software | Arrow Collapse ...
- Process Flowchart | Basic Diagramming | Rainfall Bar Chart | Green ...
- Last resort hotel book room process - DFD | Hotel reservation ...
- Png Clipart Bank Check