"A value chain is a chain of activities that a firm operating in a specific industry performs in order to deliver a valuable product or service for the market. ...
The concept of value chains as decision support tools, was added onto the competitive strategies paradigm developed by Porter as early as 1979. In Porter's value chains, Inbound Logistics, Operations, Outbound Logistics, Marketing and Sales and Service are categorized as primary activities. Secondary activities include Procurement, Human Resource management, Technological Development and Infrastructure." [Value chain. Wikipedia]
This Porter's value chain matrix diagram example was created using the ConceptDraw PRO diagramming and vector drawing software extended with the Matrices solution from the Marketing area of ConceptDraw Solution Park.
Porter's value chain matrix

 Fishbone Diagrams
The Fishbone Diagrams solution extends ConceptDraw PRO v10 software with the ability to easily draw the Fishbone Diagrams (Ishikawa Diagrams) to clearly see the cause and effect analysis and also problem solving. The vector graphic diagrams produced using this solution can be used in whitepapers, presentations, datasheets, posters, and published technical material.
 Stakeholder Onion Diagrams
The Stakeholder Onion Diagram is often used as a way to view the relationships of stakeholders to a project goal. A basic Onion Diagram contains a rich information. It shows significance of stakeholders that will have has influence to the success achieve
 Fishbone Diagram
Fishbone Diagrams solution extends ConceptDraw PRO software with templates, samples and library of vector stencils for drawing the Ishikawa diagrams for cause and effect analysis.
 Rapid UML
Rapid UML solution extends ConceptDraw PRO software with templates, samples and libraries of vector stencils for quick drawing the UML diagrams using Rapid Draw technology.
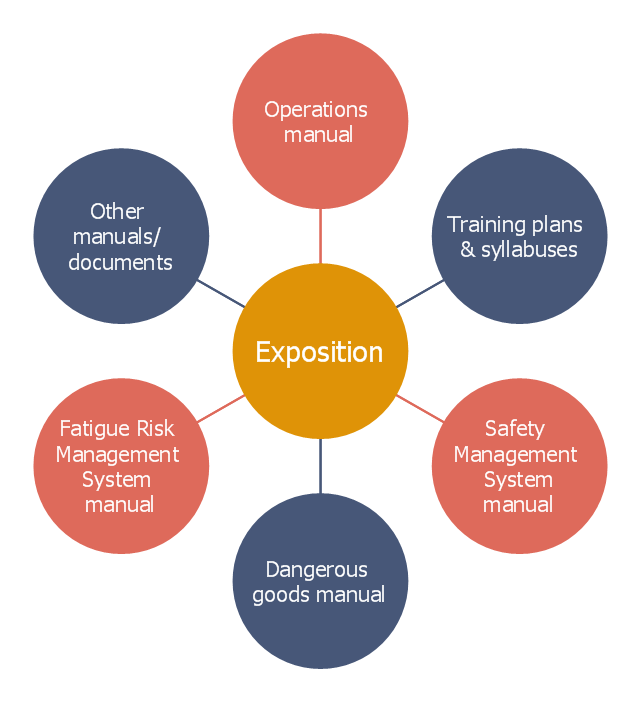
This circle-spoke diagram example was crated on the base of the illustration in the article "What is an exposition?" from the Civil Aviation Safety Authority (CASA) website.
"As the aviation industry transitions to new rules and safety standards through regulatory reform, organisations will be required to demonstrate to the Civil Aviation Safety Authority (CASA) how they have met the requirements outlined in the legislation, including the regulations and manual of standards applicable to their operation through a document called an exposition.
An exposition is a description of how organisations will conduct their operations to maintain the required level of safety. The exposition is the primary document, supported by a series of manuals, such as the operations manual and safety management system manual. These manuals and other supporting documents form part of the exposition document set, as shown in the ... diagram." [casa.gov.au/ scripts/ nc.dll?WCMS:STANDARD::pc=PC_ 101706]
The hub-and-spoke diagram example "CASA exposition" was created using the ConceptDraw PRO diagramming and vector drawing software extended with the Circle-Spoke Diagrams solution from the area "What is a Diagram" of ConceptDraw Solution Park.
Circle-spoke diagram
- Draw A Flow Chart To Show The Primary Sector Of Any Good The
- Primary Industry Examples With Drawing
- Stakeholder Onion Diagrams | The Flow Chart Of Primary Sector ...
- Primary Sector Image Drawing
- Divided Bar Diagrams | Pictures For Primary Sector For Drawing
- Pictures That Represent A Product Of Primary Sector
- A Flow Diagram Of Primary Sector
- Primary Secondary Tertiary Sectors Flow Diagrams Example
- Economic sector weightings | Porter's value chain matrix diagram ...
- Diagram Of Primary Industry
- Primary Secondary And Tertiary Sectors Of Clothing In Diagrams
- Diagram Of Primary Secondary And Tertiary Sectors Pictures
- A Diagram Of Primary Sector
- Draw Or Design A Picture That Represents A Products Of Primary ...
- Show Diagram For Secondary Sector
- Flow Diagram Clearly Shows The Process From Primary Through To
- Draw A Picture That Represents A Product Of Primary Secondary ...
- Draw Or Design A Picture That Represents A Product Of Sector ...
- The Flowchart Of A Primary Sector
- Economic sector weightings | Bar Diagrams for Problem Solving ...